Analyzing the page load
Home > Select Project > Analysis > Page Load Hitmap
The Page Load event occurs when an end user visiting your web applications has finished loading. Page Load events are provided in a hitmap chart, and the detailed information about each event can be viewed in timelines. This allows you to determine what prevents your web pages from loading. The following information is included.
-
Time details for each page load event section
-
Details of the loaded resources
-
Browser error data
Checking the page load event list
You can analyze load events on a single page basis. It provides the hitmap and various metrics to analyze the page load performance.
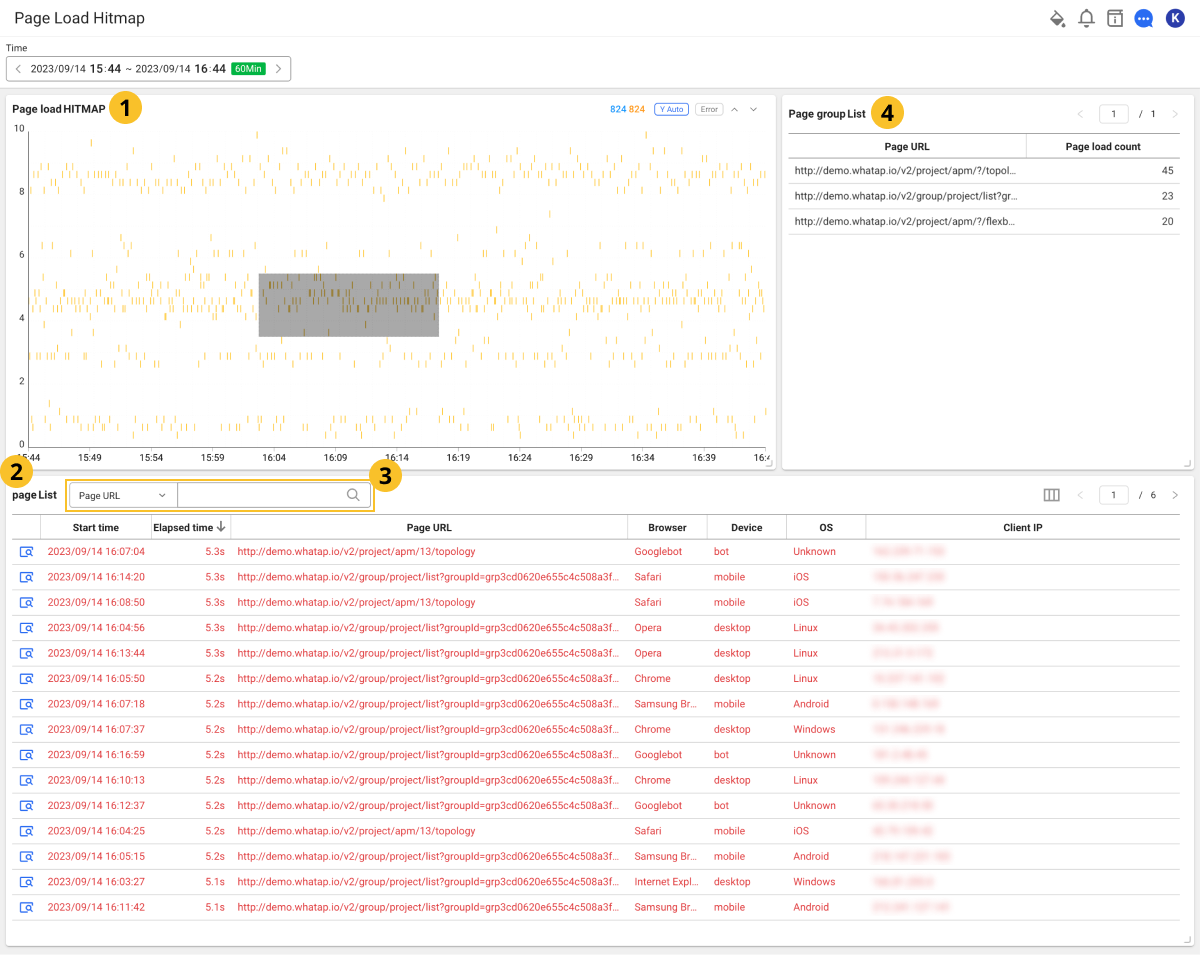
Drag the chart area of the ![]() Page Load Hitmap widget. The page load event list of the dragged area is fetched to
Page Load Hitmap widget. The page load event list of the dragged area is fetched to ![]() page List at the bottom of the screen, and the events are classified by Page Group and then fetched as
page List at the bottom of the screen, and the events are classified by Page Group and then fetched as ![]() Page group List on the right of the screen. In
Page group List on the right of the screen. In ![]() Page URL, the desired page list can be searched.
Page URL, the desired page list can be searched.
For more information on how to use the Time option, see the following.
 Page Load Hitmap
Page Load Hitmap widget is a distribution chart of response times for page loads over time.
-
The horizontal axis is the end time of the page load event.
-
The vertical axis is the elapsed time of the page load event.
-
The normal page load events are displayed in the order of Light Blue → Blue → Indigo.
-
The error occurrence page load events are displayed in the order of Yellow → Orange → Red. The erroneous page load event occurs when a browser error is encountered while loading pages.
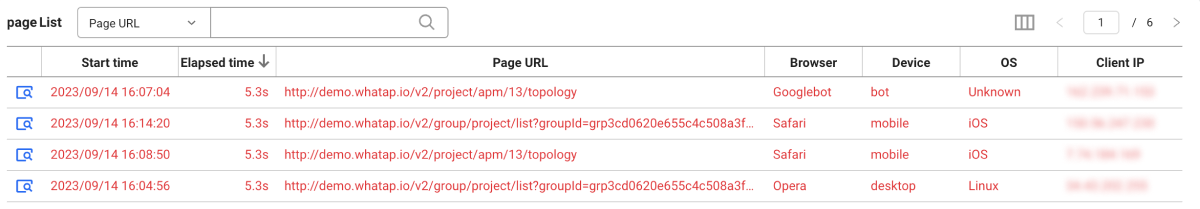
 Page list
The page load events in the area dragged from the Page Load Hitmap widget appear in the table for page List widgets. If you select  on the utmost left of each item in the list, the Page load Detail window appears.
The table of the page List widget includes the following data.
-
Start time: Start time of the page load event.
-
Elapsed time: Elapsed time up to the page load event completion.
-
Page URL: Path of the page URL accessed by the end user.
-
Browser: Type of the browser of the end user.
-
Device: Type of the device of the end user.
-
OS: OS type of the device used by the end user
-
Client IP: IP address of the device used by the end user
You can add other data columns to the table, or you can hide the added columns. Select ![]() on the upper right of the page List widget.
on the upper right of the page List widget.
-
In the page list, the page load events that contain browser errors appear in red.
-
WhaTap basically stores the client-related information.
 Filtering the page list
You can enter a search word for the page list and then filter for matches. The search criteria are as follows. Select a desired item, enter a search word and then press Enter, or select ![]() .
.
- Page URL
- Browser
- Device
- OS
- Client IP
- User ID
 Page group list
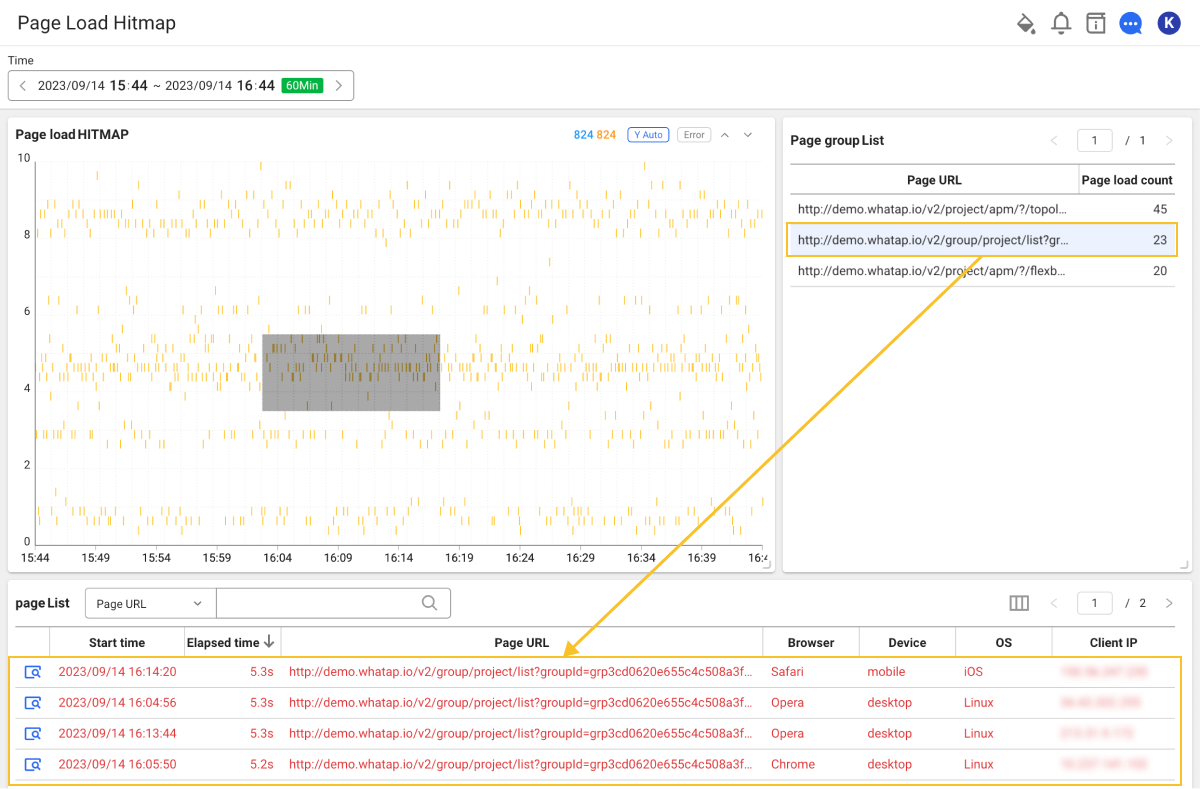
In the Page Load Hitmap widget, you can check the page load events of the dragged area by Page Group. If you select a desired item in the list, the selected page load events corresponding to the selected page group appear in the page List.
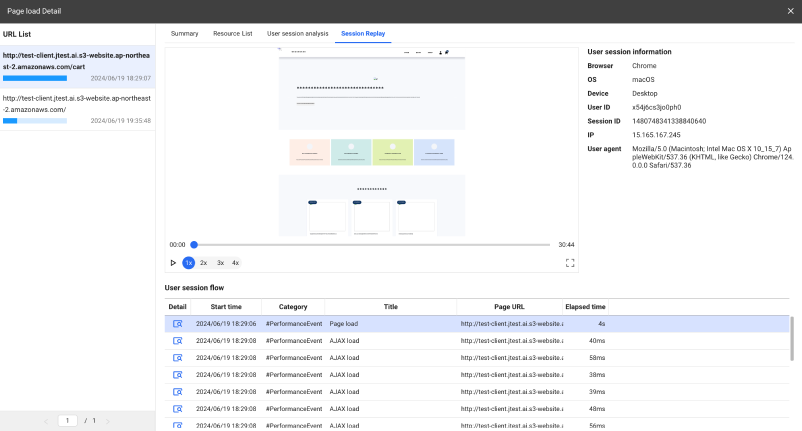
Page Load Event Detail
If you select on the utmost left of each item in page List, the Page load Detail winndow appears. It provides various metrics to analyze the page load performance and the factors that affect the performance.
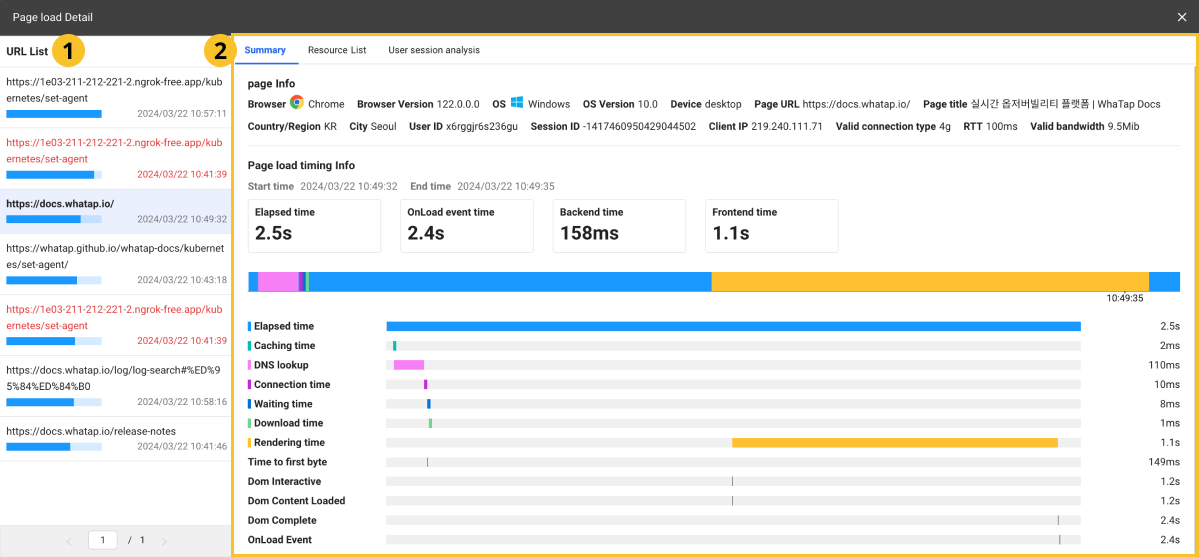
URL list
The items in the page List can be seen on the URL basis. URL list is sorted by the elapsed time. If you select a URL item, you can see the detailed information about the page load events on the right of ![]() .
.
- The blue bar graph of each item is the elapsed time of page load.
- The time to the right of the bar graph for each item is the start time of page load.
Overview (Page Load Event Summary)
The Summary tab provides the times spent for the page load step in a graph chart. This allows you to identify slow sections during the page load.
-
page Info: It provides the end users' access environment, access pages, User ID, and Session ID.
-
Page load timing Info: You can check the times elapsed for each section upon page load.
-
redirect: Elapsed time for browser's redirection.
-
cache: Time spent for the browser to search the cached resources.
-
dns: Time spent for the browser to search domains.
-
wait: Time spent for the browser to respond to the data required for page load.
-
download: Time taken for the browser to download resources from the server.
-
render: Time spent to render the resources downloaded from the server on the screen and complete a page load event.
-
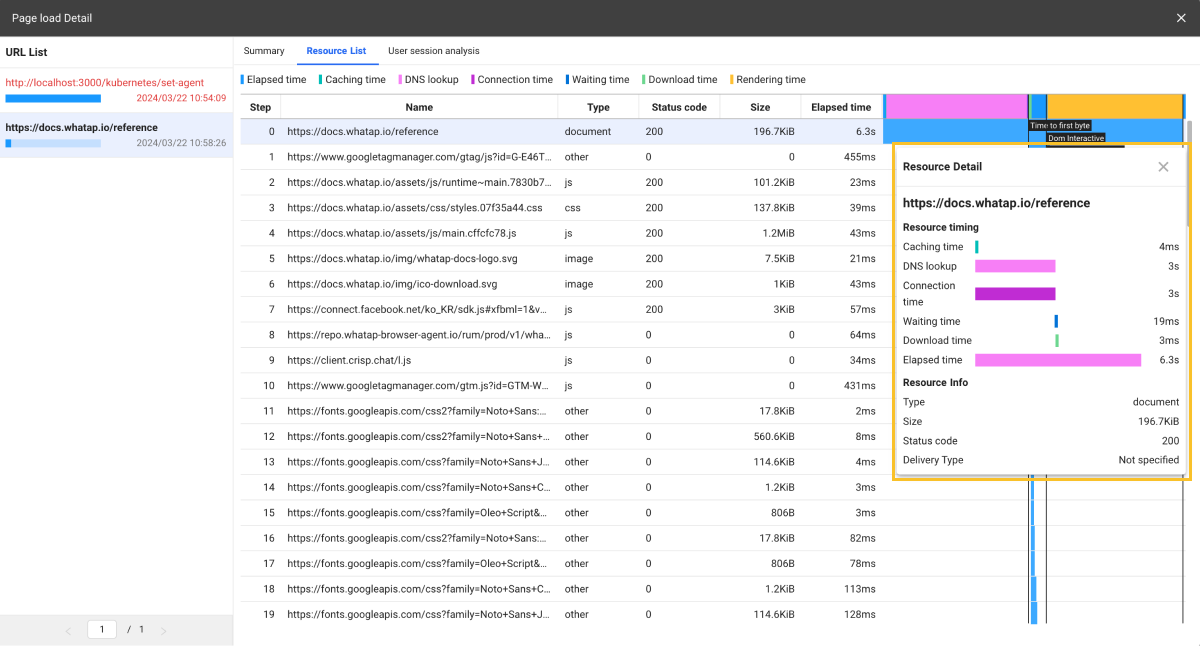
Resource list
The resources downloaded from the server by the browser can significantly affect the page load performance. The Resource List lets you quickly identify the resources that are slow to load or have large files.
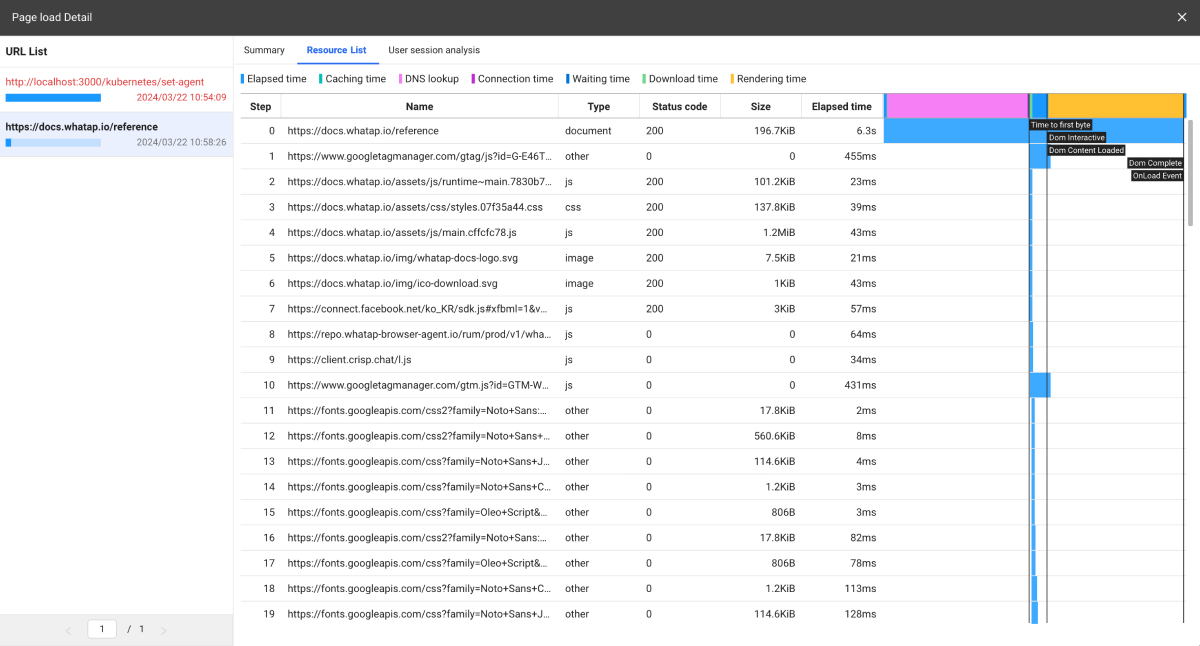
We provide a timeline chart based on the start times for each resource so that you can identify which resources are loaded slowly. By seeing the file sizes of each resource, you can improve the performance impact. You can check the detailed time information through the Resource Detail window that appears when you click each resource.
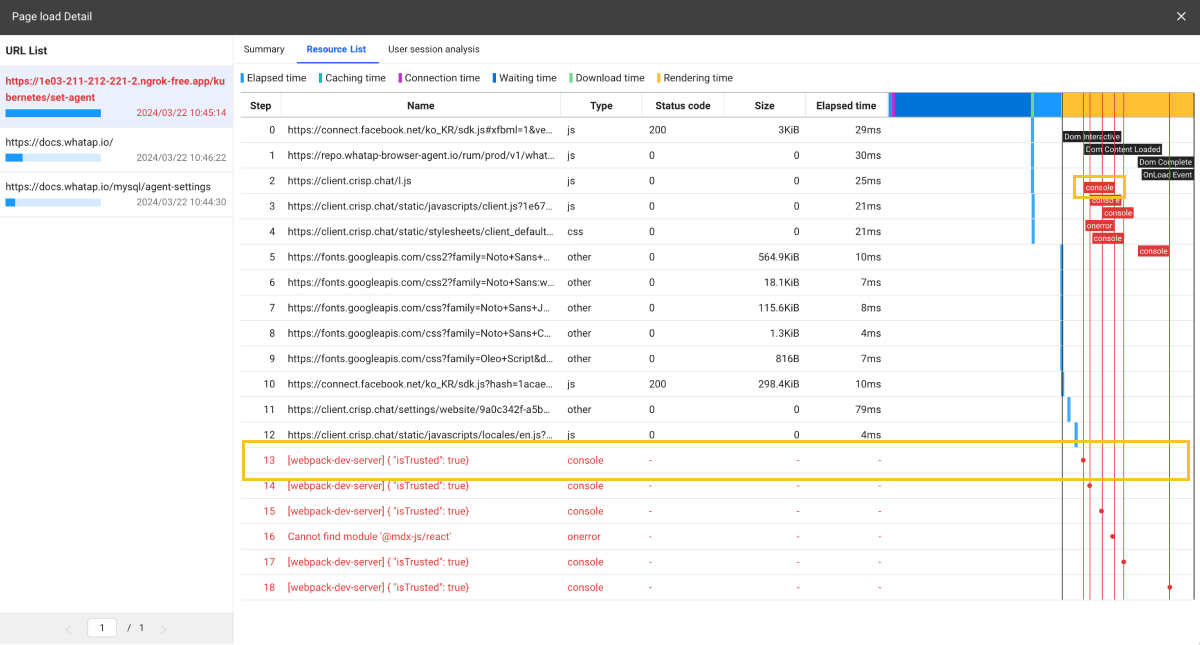
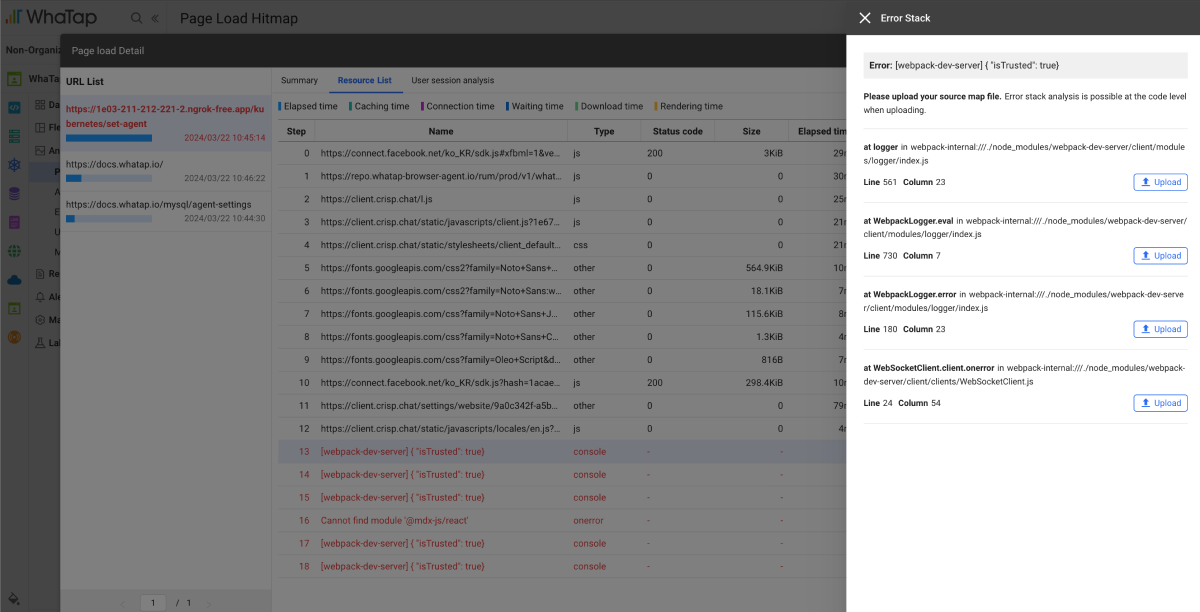
Checking the browser errors
The page load events that contain browser errors appear in red. You can see the steps in which errors occurred in Resource List.
-
If you select a step with any error in Resource List, the Exception stack window appears.
-
Select Upload.
-
Select a source map file for the code stack.
By comparing obfuscated stack information with JavaScript source map, you can see the code where the actual error occurred.
User session analysis
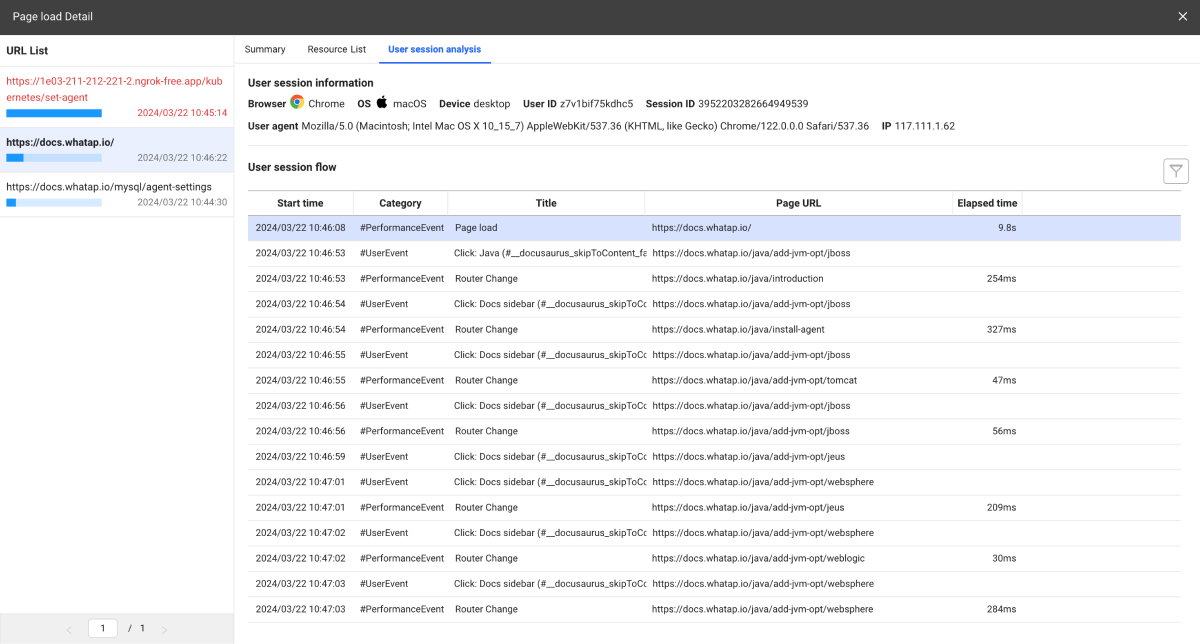
Based on the user session, you can see the events and errors that occur while interacting with the website in chronological order. For more information about User session analysis, see the following. It provides the feature to record and replay all events that users perform on the website. The Session replay feature allows you to reproduce user behaviors such as clicking, scrolling, typing, and page switching. This helps you understand exactly how users actually interact with the website. For information about application of the Session replay feature by using agent options, see the following. For more information about using the Session replay feature, see the following.Session replay