AJAX HITMAP
Home > Select Project > Analysis > AJAX Hitmap
The Asynchronous JavaScript and XML (AJAX) technology exchanges data and updates web pages in an asynchronous manner. AJAX allows you to create a more complex web page that update part of the page without reloading the entire page. AJAX also allows you to work asynchronously, enabling the code to continuously run while reloading part of the web page.
AJAX has advantages such as user experience improvement and reduction of requests to the server. However, because AJAX is implemented with JavaScript code running in the browser, it requires monitoring for the following reasons:
-
You have to make sure that AJAX requests are handled properly.
-
You have to check the performance degradation caused by AJAX requests.
-
You have to understand the user-perceived performance including the network latency, download time, and such.
In the AJAX Hitmap menu provided from Browser Monitoring, you can see the response times of AJAX events over time on a hitmap chart. You can also see the detailed information for each event. The provided information is as follows:
-
Detailed time information for each AJAX event section
-
AJAX request URL, calling page information, etc.
-
Error message and status code
Basic screen guide
AJAX Hitmap
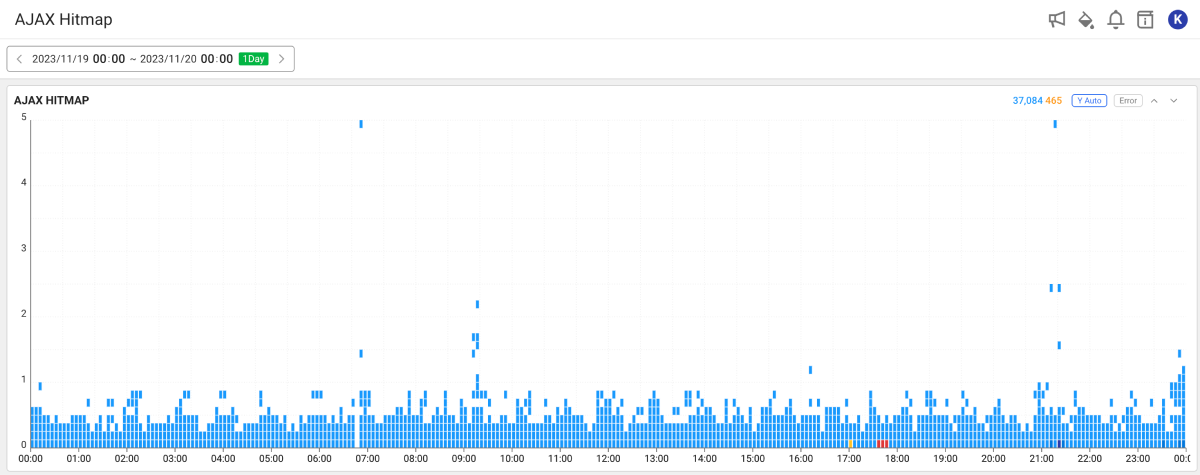
This widget displays the response times for AJAX events over time in a distribution chart.
-
The horizontal axis is the AJAX event end time.
-
The vertical axis is the AJAX event's elapsed time.
-
The normal AJAX events are displayed in the order of Light Blue → Blue → Indigo.
-
The error occurrence AJAX events are displayed in the order of Yellow → Orange → Red. An error AJAX event occurs when the status code is
0or more than400. If the status code is0, the request is not passed from the browser to the server.
AJAX List
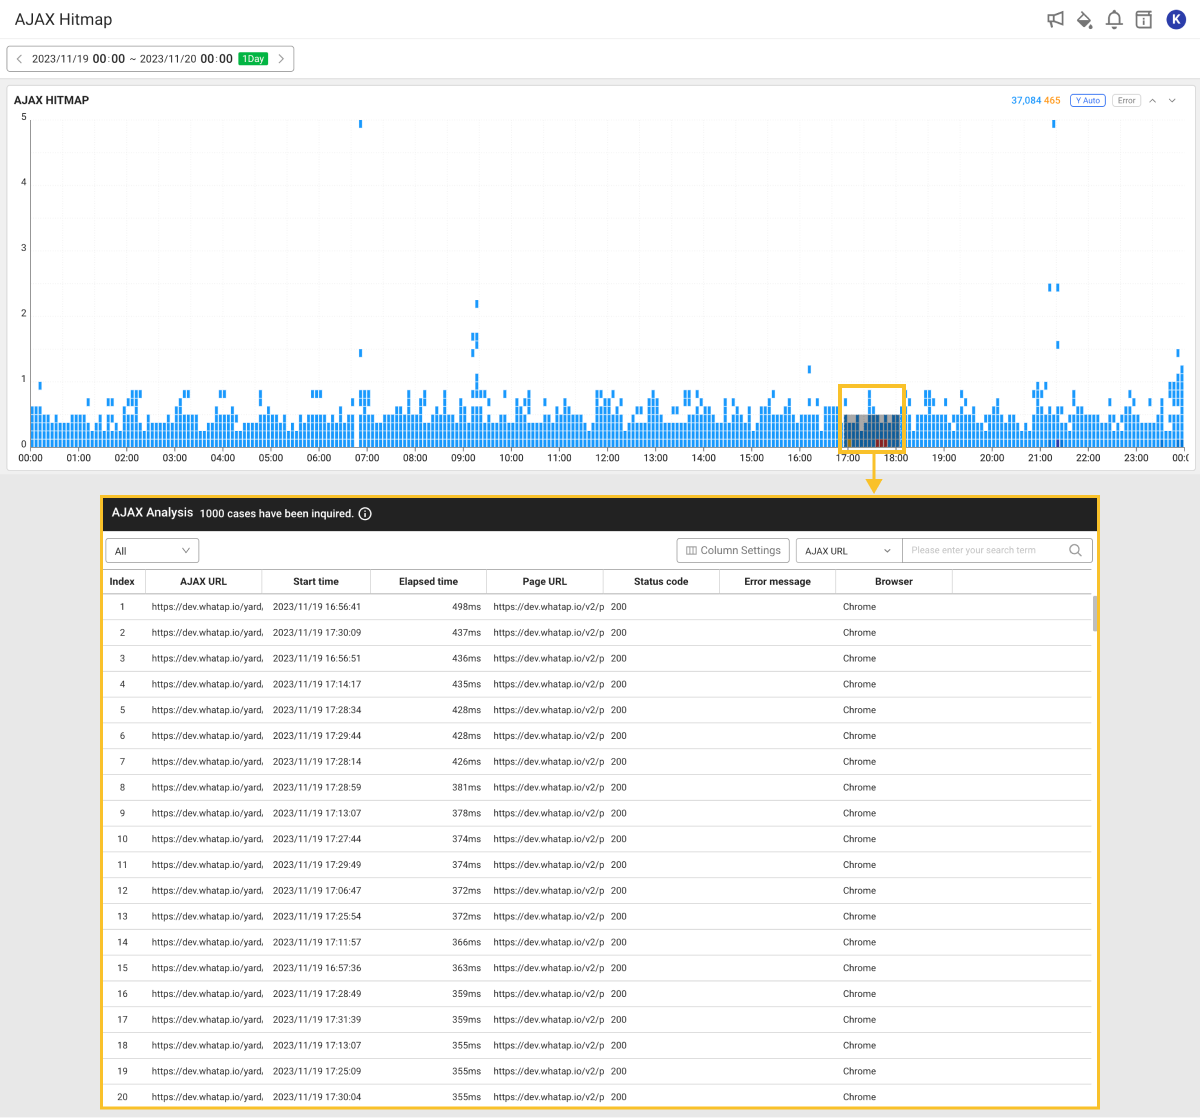
If any part is dragged in the AJAX Hitmap chart, the AJAX Analysis window appears to display the AJAX event list and details of the dragged area.
The following show the descriptions for columns in the table.
-
AJAX URL: AJAX event URL
-
Start time: AJAX request start time
-
Elapsed time: Elapsed time until the AJAX event completion
-
Page URL: URL of the AJAX event called page
-
Status code: Response status code of the AJAX event
-
Error message: AJAX response value (
statusText) when the status code is0or more than400NoteAJAX events whose status code is
0or more than400appear in red in the list. -
Browser: Type of the browser used by the end user
For more information about the column that can be added using the Add a column button, see the following.
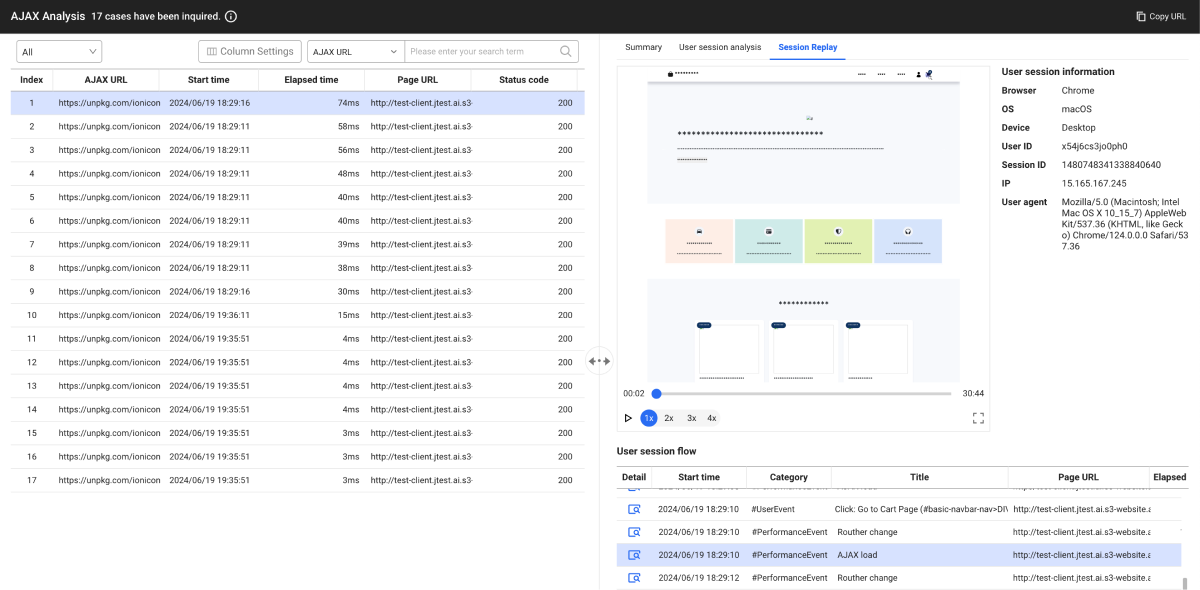
Checking the AJAX event details
If you select each item in the AJAX Analysis window, the AJAX Info window appears on the right to display the detailed information.
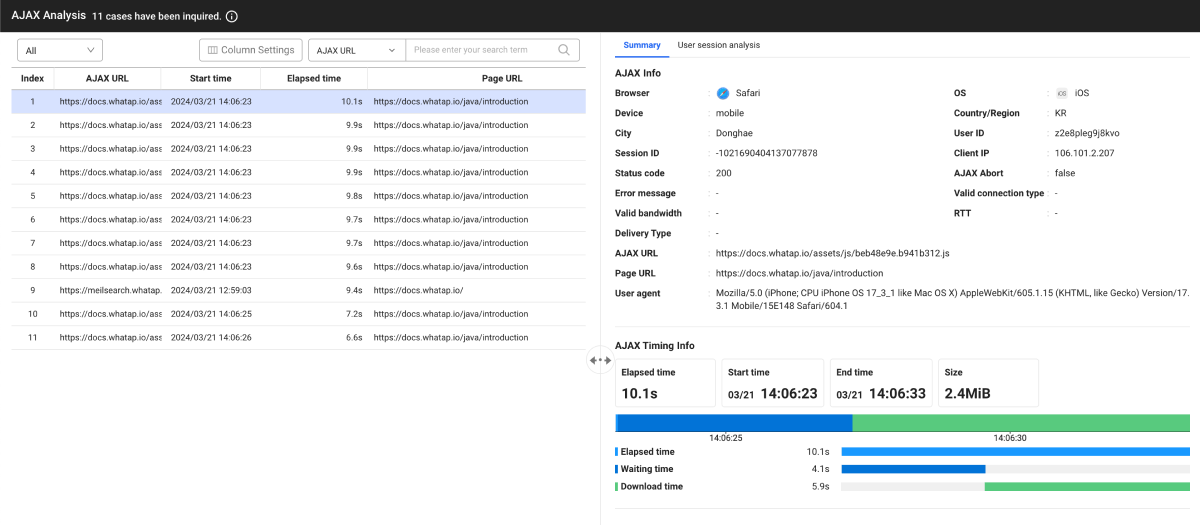
The times required for each section is provided in a graph chart while loading the AJAX events. The chart helps you identify slow sections while loading AJAX events and enhance them.
To see only the AJAX list that has errors, on the upper left of the AJAX Info window, select from the Error All choose list.
AJAX information
You can see the properties of the AJAX event. You can see the information such as AJAX request URL, end user access environment, access page information, User ID, Session ID, and Client IP.
WhaTap basically stores the client-related information.
AJAX timing information
The AJAX event loading process is divided into the following steps and the times required for each section are displayed.
-
Redirection time: Time taken by the browser to redirect an AJAX request
-
Caching time: Time taken by the browser to retrieve cached AJAX resources
-
DNS lookup: Time taken by the browser to retrieve the AJAX request domain
-
Connection time: Time taken to establish TCP connection with the AJAX request target server
-
SSL time: Time taken to complete the SSL/TLS handshake
-
Waiting time: Time taken from the start of the browser's HTTP request to the time when the server receives the request and begins responding. The transaction processing time in the server is included in this section.
-
Download time: Time taken by the browser to download the AJAX response values from the server
User session analysis
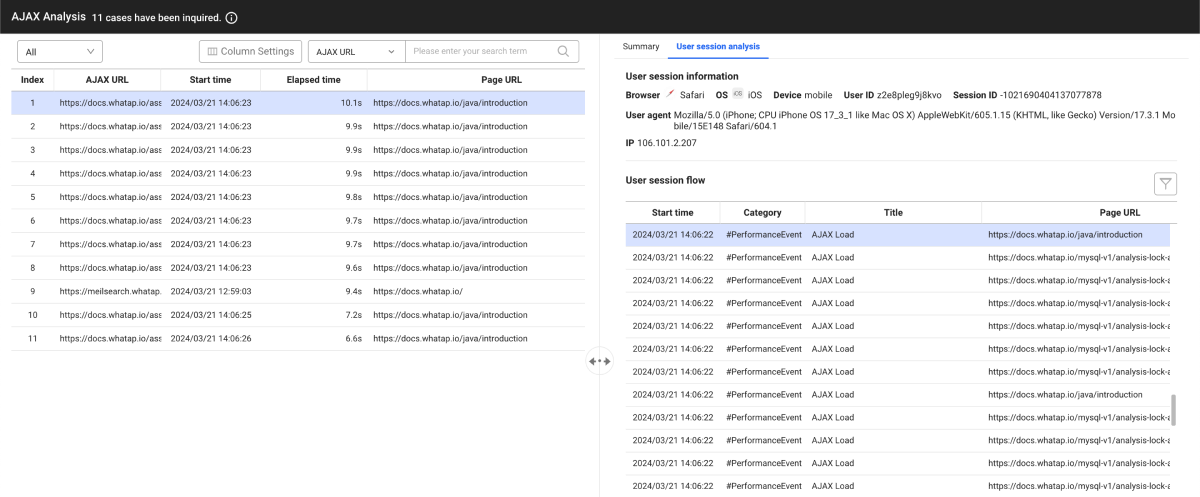
Based on the user session, you can see the events and errors that occur while interacting with the website in chronological order. For more information about User session analysis, see the following. It provides the feature to record and replay all events that users perform on the website. The Session replay feature allows you to reproduce user behaviors such as clicking, scrolling, typing, and page switching. This helps you understand exactly how users actually interact with the website. For information about application of the Session replay feature by using agent options, see the following. For more information about using the Session replay feature, see the following.Session replay
Filtering the AJAX list
You can enter a search term for an AJAX list and filter matches. Select desired search criteria and then enter a search term. Press Enter or select ![]() to see the filtered results.
to see the filtered results.
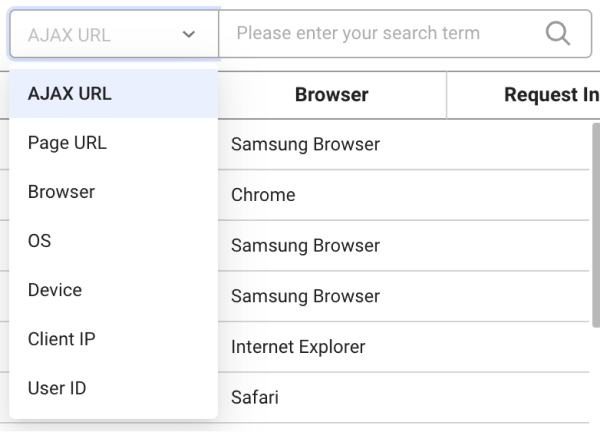
The query criteria that can be selected for filtering are as follows:
- AJAX URL
- Page URL
- Browser
- OS
- Device
- Client IP
- User ID
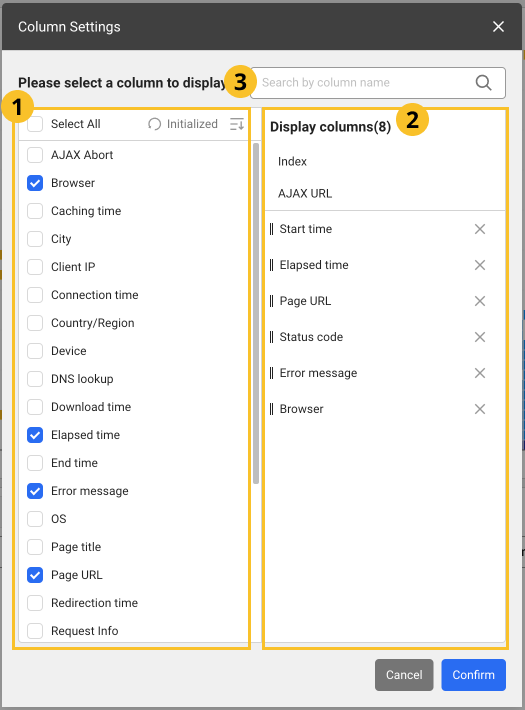
Setting the table columns
You can hide table header columns in the AJAX list or add desired items. You can also change the column order. Select Column settings.
-
After configuration, select OK to apply the settings in the table.
-
In the
 search bar, enter text to search the desired columns. Only the columns that meet the entered text are displayed.
Adding columns
From the ![]() list, select the items to add as table header columns. To select all items, select Select All. The column items that can be added are as follows:
list, select the items to add as table header columns. To select all items, select Select All. The column items that can be added are as follows:
| Column name | Description |
|---|---|
| Client IP | IP address of the device used by the end user |
| AJAX Abort | If the AJAX request is stopped in the browser level, true appears. |
| User agent | End user's agent string collected by the browser agent |
| Size | Capacity for AJAX response values indicating the actual uncompressed capacity |
| Country/Region | End user's country code |
| City | End user's city name |
| Download time | Time taken by the browser to download the AJAX response values from the server |
| Device | End user's device type |
| Redirection time | Time taken by the browser to redirect AJAX requests |
| User ID | End user ID assigned randomly |
| Session ID | End user's session ID |
| Connection time | Time taken to establish TCP connection with the target server of the AJAX request |
| Waiting time | Time elapsed from the start of the browser's HTTP request to the time the server receives the request and starts responding |
| Browser | Type of the browser used by the end user |
| OS | OS type of the device used by the end user |
| End time | AJAX event end time |
| Caching time | Time taken by the browser to search the cached AJAX resources |
| Page title | Title of the HTML page accessed through the browser |
| DNS lookup | Time taken by the browser to search the AJAX request domain |
| SSL time | Time taken to complete the SSL/TLS handshake |
| Valid connection type | Network performance measured after the browser accesses the page |
| Valid bandwidth | Value rounded to the 25 kilobits per second whose downlink speed is in Mbps. |
| Delivery Type | How to send resources (e.g. cache or navigational-prefetch) |
| RTT | The round-trip time (RTT) is the time (in milliseconds) taken to initiate a network request and then receive the response. |
WhaTap basically stores the client-related information.
Deleting columns
From the ![]() list, unselect the columns to delete. Alternatively, select
list, unselect the columns to delete. Alternatively, select ![]() on the right of the item to delete from the
on the right of the item to delete from the ![]() list.
list.
Changing the column order
Drag an item to reposition from the ![]() list, and then move it to the desired position.
list, and then move it to the desired position.
Initializing the configuration
To cancel all changes and reset them, select ![]() Reset.
Reset.