Third quarter guidance
Here’s an overview of new features and notable changes of WhaTap’s 3rd quarter services in 2024. Take a look at new features offered by WhaTap at a glance.
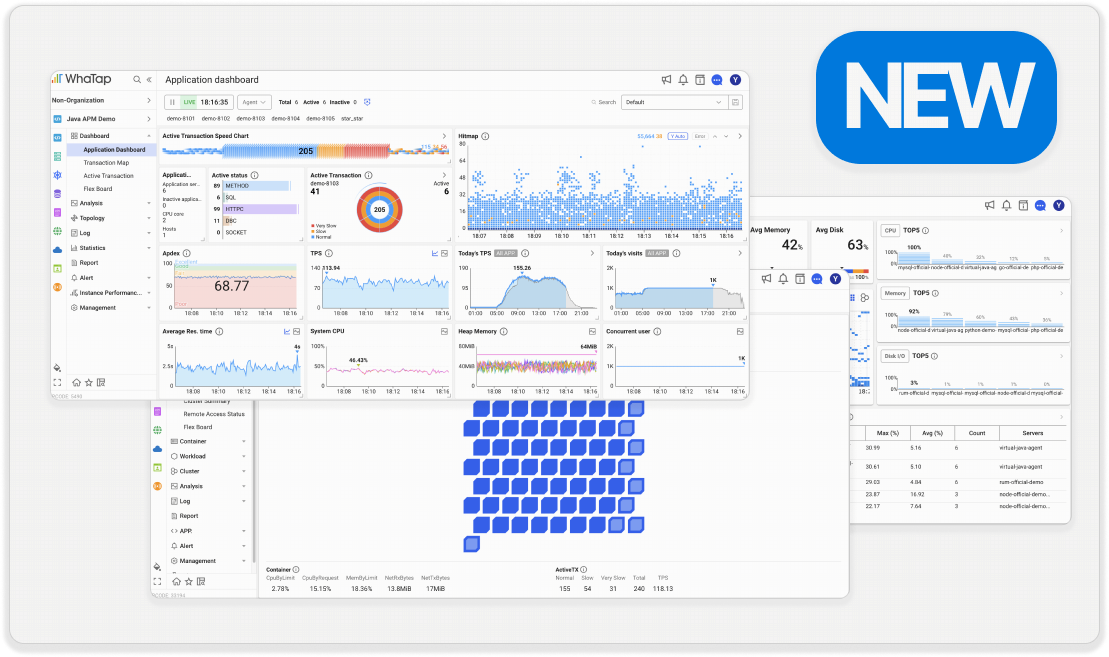
Common |
---|
- The Event Configuration menu has been improved.
- The
Application
,Kubernetes
, andDatabase
product suites newly provided the Metrics ChartNew
menu.
Application |
---|
Common menus such as Statistics and Instance Performance Management have been improved.
Server |
---|
- The Unix HP-UX installation package has been provided.
- The Server Inventory menu has been newly provided.
Kubernetes |
---|
- New menus such as Node Map, Node Timeline, and Node Disk List have been added, and the existing Node List menu has been improved.
- The Container summary analysis and Pod summary analysis features have been newly provided.
- The Service List menu has been newly provided.
Database |
---|
- The
V2
services forOracle
,Altibase
, andCubrid
products have been provided.- The official services for the
Oracle Pro
product have been provided.- The Script Manager menu has been newly provided.
- The functionality of the Monitoring Multiple Instances menu has been improved.
Browser |
---|
The functionality of the Session replay feature has been stabilized.
An overview of changes other than new features for each product, the corresponding release versions, and changes in the agent can be found in the following guide.
Common
In the WhaTap Common
section in Q3 2024, the Event Configuration menu has been newly improved and the newly reorganized Metrics Chart New
menu has been introduced.
The searching feature has been added to the existing Event Configuration menu and the new Event Configuration New
menu. You can search for events by entering a string based on Event title, Metric name in the search bar on the upper right of the event list, or by selecting the desired criteria from Event name or Event reception tag and then entering a string.
The Application
, Kubernetes
, and Database
product suites newly reorganized the Metrics Chart New
menu. Metrics Chart New
is designed to enable monitoring tasks more efficient by significantly improving the user experience.
You can easily add charts by processing Time, Target, and Interval settings at a time. You can also freely change the time range of the dashboard widget, and the batch change and preset features make configuration management easier. In addition, you can freely adjust the dashboard layout and widgets, making chart analysis more efficient.
The following overview guide helps you understand what's new and what's not in the Common section for the 3rd quarter in 2024, along with the released versions.
Guide to new features and major changes
-
Changed
In Account management or Alert > Notification Setting, changed the success message displayed when testing mobile device notifications.Service 2.7.0
-
Changed
Changed the organization icon to be exposed in the organization list in the side menu.Service 2.7.0
-
Changed
In the Reservation of Report Email window of the 보고서 menu, changed the time text to guide to a phrase that includes the time zone.Service 2.7.0
-
Feature
Added the feature to search for agents by IP address in the integrated search in the side menu.Service 2.7.0
-
Feature
Added the feature to automatically focus on the project search field when you expand the project list by selecting All projects from the side menu.Service 2.7.0
-
Changed
Removed the label display for individual graphs in the vertical equalizer bar chart.Service 2.8.0
-
Feature
Added the font color selection option for rich text widgets.Service 2.8.0
-
Feature
Added theOR
option between conditions in a metric type filter.Service 2.8.0
-
Changed
Changed the Korean term, Event resolution that is related to the alert messages in batch.Service 2.8.0
-
Changed
Changed the Turn off browser notification feature for notification messages displayed on the screen in real time to the Close all notifications feature that allows you to close all notifications.Service 2.8.0
-
Feature
In Event configurationNew
, added the feature to search by Event name or Event receiving tag.Service 2.8.0
-
Feature
Added a third-party plugin to receive alerts via PagerDuty in the Notification Setting menu.Service 2.8.0
-
Feature
In Notifications, added the third-party plugin to receive alert notifications via Teams Workflows because the Office 365 connector method has been deprecated.Service 2.8.0
-
Changed
Changed the location and UI of the Integrated Group Management button.Service 2.8.0
-
Changed
In Management > Agent install, removed the caution messages regarding the access keys.Service 2.8.0
-
Feature
Added the feature to download the member list as a CSV file from the following menu path (Project members, Integrated member management, Member list under Management).Service 2.8.0
-
Changed
Changed some colors for themes.Service 2.8.0
-
New
Added the Analysis > Metrics chartNew
menu.Service 2.8.0
-
Changed
In Real-time Alert List, changed to display event occurrence time in detail, down to month/day/hour/minute/second.Service 2.9.0
-
Changed
On the event addition screen in Alert > Event configuration, changed the phrase, Additional notification when event status is resolved to Resolved notification among the descriptions on the Pause option in theNew
menu's event addition screen.Service 2.9.0
-
Changed
In Real-time Alert List, changed the following items.Service 2.9.0
-
Feature
In Real-time Alert List, added the On/Off setting feature for the View resolved events.Service 2.9.0
-
Feature
In Account management > Account Info, added the feature to delete user's registered phone number.Service 2.9.0
-
Feature
Added the feature to adjust the width of table columns in the log related menus.Service 2.9.0
-
Feature
In View mode of the Integrated Flex board or Flex board, added the group widget layout folding feature.Service 2.9.0
For more information about the Metrics Chart New
menu, see the following.
Application
Notable new features and major changes in the Application
section of WhaTap Q3 2024 are provided, as well as improvements to common features.
WhaTap Application Monitoring provides the Statistics menu in the third quarter of this year, which allows you to view the URLs and number of calls made by specific IPs. Additionally, the feature to view the thread status of the application where the selected agent is installed and a column for CPU increase have been added to the Thread List/Dump menu under the Instance Performance Management menu.
The following overview guide helps you understand new features and major changes in the Application
product suite in Q3, 2024, along with release versions.
Guide to new features and major changes
-
Changed
In Alert > Event configuration, changed the TOO_MANY_ACTX event template conditions.Service 2.7.0
-
Changed
In Sitemap > Topology > Netstat Topology, changed the example image to English.Service 2.7.0
-
Changed
In the sub menus under Statistics, increased the width of the search field.Service 2.7.0
-
Changed
In Statistics > Caller, changed the maximum number of possible download with the CSV download feature (100,000 → 10,000)
.Service 2.7.0
-
Changed
In Instance performance management > Heap dump, changed to always display the guide message related to the heap dump acquisition
.Service 2.7.0
-
Changed
In sub menus under Instance performance management, modified to maintain the agent selection status when it is moved to another submenu with the agent selected
.Service 2.7.0
-
Changed
Changed the Multi-Transaction tab of the Trace analysis window not to expose transactions if there is no host information.Service 2.7.0
-
Changed
In the Table view and Tree view tabs of the Trace analysis window, modified not to display the port if there is not transaction host data.Service 2.7.0
-
Feature
In the table of the Instance performance management > Thread list/Dump menu, added the column that displays the CPU time increment.Service 2.7.0
-
Feature
In Management > Agent configuration, added the feature to download the configuration (whatap.conf) file of the agent selected from the path.Service 2.7.0
-
Feature
Added the feature to download the content viewed in the following path as a CSV file.Service 2.7.0
-
New
Added the IP Transaction menu to view the URLs and number of calls for each IP.Service 2.8.0
-
New
Added the log monitoring feature to the Node.js products.Service 2.8.0
-
Changed
Changed the order of default columns in the Trace analysis window.Service 2.8.0
-
Changed
In Dashboard > Application dashboard, changed the Active transation equalizer widget name to Active transaction, and modified to display the widget name on one line without line breaks.Service 2.8.0
-
Changed
Increased the size of the Apdex widget guidance modal in Dashboard > Application dashboard to improve readability, when the user-defined language is English.Service 2.8.0
-
Changed
Changed the filtering selection box in the Trace analysis pop-up window to a group-type button.Service 2.8.0
-
Changed
In submenus under Statistics, added the filter values that are delivered when moved to the Search transaction menu.Service 2.8.0
-
Changed
In Statistics > Error, modified to view the initial data with the Error Only filter activated when the Analysis > Search transaction menu appears through the Detail analysis feature.Service 2.8.0
-
Feature
In the Table view tab of the Trace analysis window, added the feature to download SQL statements with bind variable mapped to them.Service 2.8.0
-
Feature
In Instance performance management > Thread list/Dump, added the feature to display the thread status (RUNNABLE, WAITING, Total Count) of the application with the selected agent installed.Service 2.9.0
Agent guide
Java
Java Agent v2.2.36
July 18, 2024
Feature
Added the setting to return the original class if the weaving plugin compile version is different from the user code target version.
Java Agent v2.2.37
July 31, 2024
Feature
If an exception occurs that passes through the spring-boot ExceptionHandler, it replaces the previous exception.
Java Agent v2.2.38
August 14, 2024
-
Feature
spring-boot-3.2 tracing -
Deprecated
Stopped tracing the keys and parameters of the lettuce driver.
PHP
PHP Agent v2.8.1
July 24, 2024
-
New
Added the agent configuration options to collect transaction statistics by IP address. -
Feature
Added the agent configuration option for setting the statistics compression transmission.
PHP Agent v2.8.2
September 11, 2024
New
Added the option to prioritize environment variables over the agent configuration file (whatap.ini).
Node.js
Node.js Agent v0.4.98
July 9, 2024
New
Added the agent configuration options to collect transaction statistics by IP address.
Node.js Agent v0.5.0
August 12, 2024
-
New
Added the agent option to set the path of WhaTap agent log file. -
Feature
Added the monitoring feature for the Node.js embedded function,fetch
. -
Feature
Added the Redis monitoring package. (ioredis)
Node.js Agent v0.5.1
August 28, 2024
-
New
Added the agent option to create the agent name (ONAME) by adding the port number (e.g. NODE-14-103-3000). -
New
Added the agent option for log monitoring.
Python
Python Agent v1.6.8
August 27, 2024
New
Added the module tracing feature to support various versions of graphql-core.
Python Agent v1.6.9
September 3, 2024
New
Added the tracing feature for the oracle-client module.
Python Agent v1.6.10
September 5, 2024
New
Added the feature to support ASGI in the Django framework.
.NET
.NET Agent v2.2.9
July 5, 2024
Feature
Supporting multi-transaction monitoring: You can trace calls between the application services registered as projects on the WhaTap monitoring platform.
.NET Agent v2.3.1
August 26, 2024
-
New
Added the feature to collect traces that occur outside of transactions. -
New
Display DB connection information: Added the feature to display database connection information for transactions using the database.
.NET Agent v2.3.2
September 5, 2024
New
Added the agent option to set suffix of URLs to exclude from transaction collection.
.NET Agent v2.3.3
September 25, 2024
-
New
Added support for SQL parameter monitoring in .NET Core. -
New
Added support for Stored Procedure monitoring in .NET Core. -
New
Added theSystem.Net.Http.HttpClient.SendAsync
monitoring feature for support.
Go
Go Agent v0.4.1
August 28, 2024
-
New
Added the standard output log collection feature. -
New
Added the option to process environment variables first over the agent configuration file (whatap.conf).
-
The
Node.js
product provides the log monitoring. -
.NET
products support multi-transactions.
-
For more information about the IP Transaction menu, see the following.
-
For more information on how to use the Thread List/Dump menu, see the following.
Server
Notable new features in the Server
section of WhaTap Q3 2024 include the Unix HP-UX
installation package and the new Server Inventory menu.
WhaTap Server Monitoring provides a new Server Inventory menu in this third quarter. The Server Inventory feature systematically manages the physical and virtual characteristics of the server, as well as the operation environment. Automatically collected server components and user-defined items allow you to understand and manage the server's configuration in detail.
Custom columns can be configured through custom items to monitor the server status and performance in more detail and respond to issues. For example, you can add information about the operation managers for direct communication with each server manager, enabling a quick response upon an issue. Additionally, the Server Inventory menu allows you to quickly filter servers that meet your criteria through three-level multi-sorting. The default sorting is performed based on OS type, Model, and Serial information.
Unix HP-UX
agent installation package is provided. HP-UX
is the high-performance Unix operating system developed by Hewlett-Packard (HP), known for its stability and performance on Itanium and PA-RISC systems.
WhaTap supports HP-UX
Itanium 11.23 and PA-RISC-UX 11.23. The HP-UX
installation package can be easily installed with just a simple downloading and execution, and you can effectively manage and monitor the HP-UX
operating system through WhaTap Server Monitoring.
The following overview guide helps you see the new features and major changes in the Server
products in Q3 2024 along with the release versions.
Guide to new features and major changes
-
Changed
In Server list > Server list, changed the Private IP column data display method in the table.Service 2.7.0
-
Changed
In Process list, changed the Name column to the name that can be identified in the Server details or shell.Service 2.8.0
-
Changed
Changed to go to the Event history menu when an alert item is selected in Real-time alert list.Service 2.9.0
-
Feature
Provided the agent installation that supports the HP-UX operating system environment.Service 2.9.0
-
New
Added the Server Inventory menu where the agent automatically collects and stores information for infrastructure server operation, and allows you to view and manage information added through user-defined fields.Service 2.9.0
Agent guide
Server Agent v2.6.2
July 16, 2024
Feature
Added the feature to run bat and powershell scripts on Windows agents.
Server Agent v2.6.3
July 24, 2024
Feature
Added the server inventory collection option.
Server Agent v2.6.7
September 3, 2024
Feature
Added the support of IMDS v2.
Server AIX Agent v1.3.4
September 19, 2024
New
Added the feature to collect server configuration data.
Server HP-UX Agent v1.3.4
September 19, 2024
-
New
Provided the feature to support for HP-UX (IA64, PA-RISC) 11.24. -
New
Added the feature to collect server configuration data.
Server Solaris Agent v1.3.4
September 19, 2024
New
Added the feature to collect server configuration data.
Server Agent v2.6.8
September 20, 2024
-
Feature
Added chrony to support the server time synchronization. -
Feature
Improved to use alternative counters if Windows Server disk performance counters are not available.
For more information about the Server Inventory menu, see the following.
Kubernetes
Notable new features and changes in the Kubernetes
section of WhaTap Q3 2024 include new features such as Node Map, Node Timeline, Node Disk List, Service List 및 Container summary analysis, and Pod summary analysis .
WhaTap Kubernetes Monitoring provides numerous new features in this Q3, along with the node monitoring expansion. New menus such as Node Map, Node Timeline, and Node Disk List have been added, and the existing Node List menu has been improved more efficiently.
You can monitor the node status from the cluster perspective via Node Map. You can intuitively see the real-time status of nodes, resource usage, and relationships between nodes, and you can customize the dashboard to suit your preferences through the settings such as grouping, threshold settings, and labels.
In Node Timeline, you can trace the node status changes over time. For example, you can visually see the time when a specific node is removed and its status at the time point. This is useful for analyzing issues that occurred during cluster operation or past situations checking.
You can monitor the status of individual disks mounted on the node in real time via Node Disk List. And the comparison and detailed information search of the existing Node List menu have been improved. Instead of moving to the Node Detail menu, the configuration, resources, metrics, and events for the selected node can be checked via the Node List detail modal.
Additionally, WhaTap Kubernetes component analysis feature has been improved. The Container summary analysis and Pod summary analysis features have been newly provided to enable comprehensive analysis of the performance and status of each component. You can see the summary analysis information in the Target information tab of Container Map.
In addition, as part of the expansion of WhaTap Kubernetes monitoring information, the new Service List menu has been added, allowing you to check the configuration of each service and the status of the connected Pods. It provides the service information collected over the past one minute based on the query time.
Through the following overview guide, check the new features and major changes in the Kubernetes
product in Q3 2024 along with the release versions.
Guide to new features and major changes
-
New
Added the Node disk list menu for disk monitoring from a node perspective.Service 2.7.0
-
New
Added the Service List menu that provides comprehensive status and information on all services running in the Kubernetes cluster.Service 2.7.0
-
Changed
In the container list of Cluster > Node details, improved the UI of the container details button.Service 2.7.0
-
Feature
Added the feature to display the agent status at the top of the screen so that users can immediately recognize the moment when the Kubernetes agent is disabled.Service 2.7.0
-
Feature
In the Record summary tab of the Trace analysis window, added the feature to display information for Container Id and Pod Name and go to each container and Pod list pages when clicked for each.Service 2.7.0
-
Feature
Added the Pod list in Cluster > Node details.Service 2.7.0
-
Feature
In the event list table of Cluster > Kubernetes Event, added the Time the event first occurred and Number of events columns.Service 2.7.0
-
Feature
In Workload > Container Application List, added the Image column into the Resource group.Service 2.7.0
-
Feature
In Workload > Container Application List, added the button to go to the list menu for the following columns.Service 2.7.0
-
Feature
In Container > Container list, added the button to go to the corresponding list menu for the following columns.Service 2.7.0
-
Feature
In the Log > Search Log tab (summary or detailed view) of the Dashboard > Container Map menu, added the link to go to the Live Tail menu.Service 2.7.0
-
Feature
In the summary view of Dashboard > Container Map, added the service information under the Target information and Resource relations tabs.Service 2.7.0
-
Feature
In the summary view of the Dashboard > Container map menu, added the Container summary analysis feature in the Target Info tab.Service 2.7.0
-
Changed
In Management > Namespace management, added the specific guidance message when creating a namespace project.Service 2.8.0
-
Changed
In Workload > Container Application List, moved the ApplicationName and ApplicationId columns to under the Application Info column.Service 2.8.0
-
Feature
In the Pod list of Workload > Pod list, added the columns for container count and application count.Service 2.8.0
-
Feature
In the node list of Cluster > Node disk list, added the FileSystem column.Service 2.8.0
-
Feature
In the Target information tab of the Dashboard > Container Map menu, added the Service List navigation link and the feature to see the service object manifest information.Service 2.8.0
-
Feature
In Display Detail of Workload > Pod list, added the Pod summary analysis feature.Service 2.8.0
-
Feature
In the summary view of Dashboard > Container map, added the Pod summary analysis feature.
Service 2.8.0
-
New
added the Node timeline menu that displays the node status over time.Service 2.9.0
-
New
Added the Node map menu that displays the node details.Service 2.9.0
-
Changed
In the side menu, changed to expose the Analysis > Metrics chartOld
menu.Service 2.9.0
-
Changed
In Management > Agent Install, changed the default value of the installation method to YAML.Service 2.9.0
-
Changed
In Workload > Pending Pod Status, modified to expand the provided metrics when node resources are suspected to be the cause of pending.Service 2.9.0
-
Feature
In Management > Agent Install, added the option to select an agent version (Stable (recommended) /Preview).Service 2.9.0
-
Feature
In View Detailed of the Management > Kubernetes Agent List menu, added the Metrics tab that can display the metrics data.Service 2.9.0
-
Feature
In Cluster> Node Disk List, added the Comparison column and provided the detailed view screen to displays the disk usage trend in which the Comparison column has been selected.Service 2.9.0
-
Feature
Improved the comparison and detailed view features in Cluster > Node list.Service 2.9.0
-
Changed
In Report, modified to make users select multiple agents, agent group, and agent type when Monthly application report or Monthly performance comparison report is selected for a report form.Service 2.9.2
Agent guide
Kubernetes Agent v1.7.6
July 1, 2024
-
Feature
Added the tag count. -
Feature
AddedWHATAP_JAVA_AGENT_PATH
to the whatap-node-helper container environment variables (env
).
Kubernetes Agent v1.7.7
July 11, 2024
Feature
Added the integration method for Java applications and Kubernetes agents.
Kubernetes Agent v1.7.8
July 24, 2024
-
Feature
Added the Cluster > Node disk list menu. -
Feature
Added the Workload > Service list menu.
Kubernetes Agent v1.7.9
August 19, 2024
-
Feature
Added collection of RSS-related metrics in the cgroup v2 environment. -
Feature
Added the metrics for whether container's request and limit are set. -
Feature
Added node label metrics in the list format.
Kubernetes Agent v1.7.10
August 29, 2024
Feature
Added the metrics related to the node capacity and allocatable to the tag countkube_node
category.
Kubernetes Agent v1.7.11
September 11, 2024
-
Feature
Added the Pod status metric to the tag countkube_stat
category. -
Feature
Added thecreationTimeStamp
field that displays the creation times for each node to the tag countkube_node
category.
-
For more information about the Node Map menu, see the following.
-
For more information about the Node Timeline menu, see the following.
-
For more information about the Node Disk List menu, see the following.
-
For more information about the Container summary analysis and Pod summary analysis features, see the following.
-
For more information about the Service List menu, see the following.
Database
In the Database
section of WhaTap Q3 2024, the official release of Oracle Pro, the release of Oracle, Altibase, and Cubrid products V2
, the addition of the new Script Manager menu, and improved functionality of the Monitoring Multiple Instances menu have been introduced.
The WhaTap database product suite is transitioning to V2
. Following Redis and MongoDB in Q1, Oracle, Altibase, and Cubrid V2
services have been launched in Q3. The V2
had a changed structure for the data transfer pack and its UI has been improved overall.
The official service to Oracle Pro has been launched. WhaTap Oracle Pro monitors the performance metrics by directly accessing the memory of the database server, collecting up-to-date performance information up to 20 times per second. It minimizes the system load by not going through disk I/O and provides precise performance analysis including the query execution time and buffer cache status.
And in Laboratory, the new Script Manager feature has been provided. Script Manager helps you manage SQL scripts. You can save scripts in the agent installation path and fetch and execute them in real time by the monitoring service. This allows you to automate complex database tasks and monitor them easily.
It also provides new custom widgets along with improvements to the Monitoring Multiple Instances menu. In addition to the metrics provided by default on the dashboard, you can add the desired metrics.
The following overview guide helps you understand new features and major changes in the Database
product suite in Q3 2024, along with release versions.
Guide to new features and major changes
-
New
Oracle Pro services now launched!!Service 2.7.0
-
New
Oracle V2 services now launched!!Service 2.7.0
-
Changed
In Alert > Event configuration, changed the default value of the Inactive agent alert option from 30 seconds to 1 minute.Service 2.7.0
-
Changed
Changed to view before and after 30 minutes of the session execution time through the Session Details window displayed when an item is selected in the Active Sessions section in the following menu path, and the Analysis > Session History menu appears.Service 2.7.0
-
Changed
In Dashboard > Multi-instance Monitoring, changed the names of some widgets.Service 2.7.0
-
Changed
Changed the alternative guidance message of the XOS2 metrics in the Dashboard > Instance list menu to no longer appear.Service 2.7.0
-
Changed
In Dashboard > Instance Monitoring, added the error handling feature to the object details window displayed when viewing a plan.Service 2.7.0
-
Changed
Modified the following menu to display the database name in the option bar at the top of the screen.Service 2.7.0
-
Changed
Changed the Full Scan section to be displayed in red in the SQL Details window that appears when a query is selected to view the plan.Service 2.7.0
-
Feature
Added the Analysis > Top SQL comparison menu to compare SQL trends and check fluctuations over a set period based on the specific date.Service 2.7.0
-
New
AltibaseV2
services now launched!Service 2.8.0
-
Changed
In Management > Project members, modified not to invite the dbx@whatap.io account together when using the Invite WhaTap Support Team feature.Service 2.8.0
-
Feature
In Management > Agent install, added the feature to download agent files in ZIP format.Service 2.8.0
-
Feature
In Dashboard > Multi-instance Monitoring, added the custom widget to select metrics.Service 2.8.0
-
Feature
Added the feature to log user behaviors when the Session kill feature is a success or failure.Service 2.8.0
-
New
Added the Script manager menu that can see the result by executing any SQL script.Service 2.9.0
-
New
Launched the CUBRIDV2
service.Service 2.9.0
-
Changed
In Dashboard > Monitoring Multiple Instances, changed the time column to display the time as the viewed time in the Vacuum history window opened via the button of the Vacuum Sessions widget.Service 2.9.0
-
Changed
Added the support version in details of CUBRID and Altibase in the project creation screen.Service 2.9.0
-
Feature
In Dashboard > Multi-instance Monitoring, added the no merge option and guidance message to custom widgets upon entry.Service 2.9.0
MySQL
Feature
In Management > Agent install, added the guidance message about roles.Service 2.7.3
PostgreSQL / MySQL
-
2024-03-27
Service 2.3.0
Service 2.7.0
Oracle Pro
-
Feature
In Analysis > Lock tree, added the feature to display global locks when selecting a cluster.Service 2.8.0
-
Changed
In Analysis > Lock tree, changed the maximum time range for selecting a cluster to view Global Lock information to 3 hours.Service 2.8.2
Altibase
Changed
Improved calling of the active session data.Service 2.8.0
PostgreSQL
-
2024-08-28
Service 2.8.0
Service 2.8.0
Oracle V2, Oracle Pro
-
Changed
In Dashboard > Multi-instance Monitoring, changed to view the data of the Main Waits widget in theactive_session
category.Service 2.8.0
-
Feature
Added the FILTER_PREDICATES column in the Runtime Plan and Explain Plan tables of the SQL details pop-up window.Service 2.8.0
Oracle, Oracle Pro
Changed
In Analysis > SQL analysis, changed the chart display format at the top of the screen.Service 2.9.0
Agent guide
DBX
DBX v1.9.0
July 4, 2024
Oracle
New
Added new features following the Oracle V2 release.
DBX v1.9.1
July 19, 2024
Common
Feature
Added the status for the Too big data notification.
Mongodb
Feature
Added the feature to collect the DB size and collection information.
DBX v1.9.5
August 13, 2024
Oracle
Feature
Added the RAC metric.
DBX v2.0.0
August 14, 2024
Altibase
-
New
Added AltibaseV2
-
Feature
Added theobj_invalid_cnt
metric. -
Feature
Added the agent option to collect the tablespace lock data.
-
For more information about the Oracle Pro products, see the following.
-
For more information about new features in Oracle
V2
, see the following. -
For more information about new feature of the Altibase
V2
, see the following. -
For more information about new features of CUBRID
V2
, see the following. -
For more information about the Script Manager feature, see the following.
-
For more information about the custom widgets of the Monitoring Multiple Instances menu, see the following.
Feature
WhaTap launched the Beta services for Aerospike
monitoring and Apache Pulsar
monitoring in the form of feature projects (Features
) in Q3 2024. It is scheduled for official release in the future, and the support scope is to be expanded.
-
For more information about the
Beta
Aerospike
monitoring, see the following. -
For more information about the
Beta
Apache Pulsar
monitoring, see the following.