First quarter guidance
Here’s an overview of new features and notable changes of WhaTap’s first quarter services in 2024. Take a look at new features offered by WhaTap at a glance.
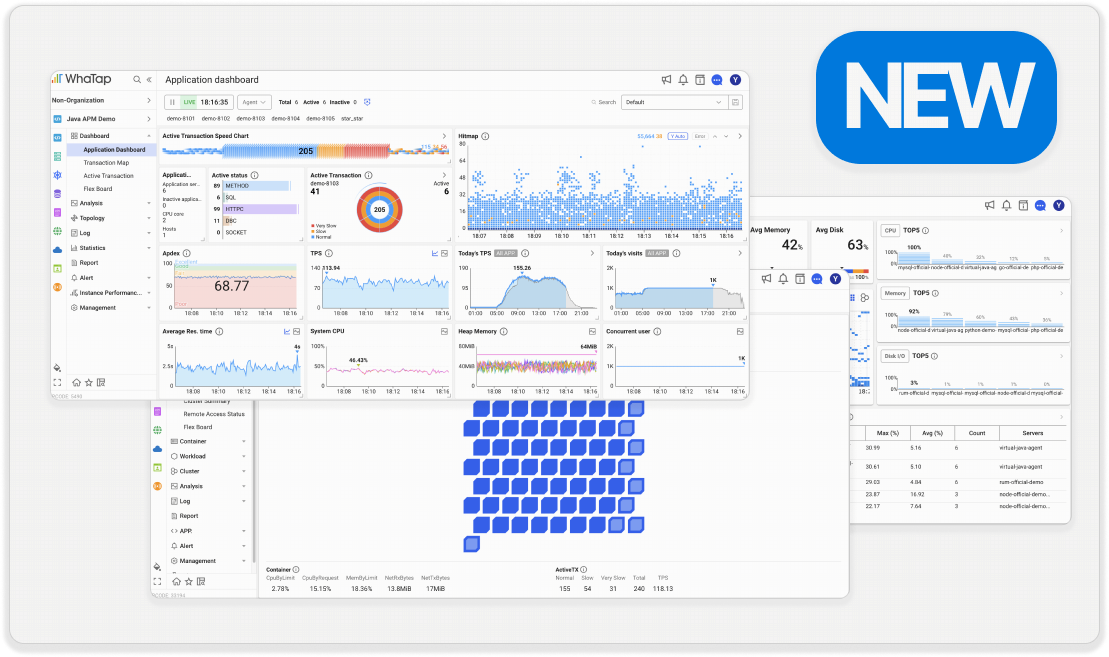
| Common |
|---|
- The Side Menu has been reorganized.
- The Event Configuration
Newfeature has been newly provided to enhance the metrics field-centeric user experience.- The SSO account linking feature has been added.
| Application |
|---|
- The menu structures of Statistics and Instance Performance Management have been improved.
- Transaction Map has been improved.
- The
Goproduct's Beta service has been terminated and the official service has been provided.
| Server |
|---|
The Unix AIX agent installation package has been provided.
| Kubernetes |
|---|
- Control plane monitoring has been newly provided. The kube-apiserver Dashboard and kube-apiserver Metrics Search features have been added for monitoring the kube-apiserver among control plane components.
- The Pod initialization performance and master meta data features have been reorganized to provide the Pod Startup Analysis and Object Manifest features.
- The Deployment List feature that allows you to search for related information based on the deployment, and the Kubernetes Agent List feature that allows you to check the installation status of master and node agents, have been added.
- Support for Helm chart installation has been provided when installing the master and node agents.
| Database |
|---|
- A new
V2service has been provided that enhances charting and collection features inMongoDBandRedisproducts.- The metrics divided into XOS and XOS2 have been integrated into XOS and changed to be displayed in percentage.
| Browser |
|---|
The User session analysis feature has been newly provided.
| Network |
|---|
The Network Performance Monitoring product has been officially released.
An overview of changes other than new features for each product, the corresponding release versions, and changes in the agent can be found in the following guide.
Common
Notable new features in the Common section in Q1 2024 include a reorganized side menu, addition of the SSO account link, and a new event configuration feature.
For better user convenience, the side menu of WhaTap Monitoring has been reorganized for the first time in 5 years. Project selection is required before using the WhaTap services. In order to make it easier to use the work flow after creating and selecting a project, the UI has been reorganized to reduce clutter compared to before, securing the area for project selection and menu space.
You can expand only the selected part of the project list for checking, and secure the vertical area to view various feature menus more easily. You can also bookmark frequently used functions in the product-specific project menu by clicking a simple star-shaped icon (

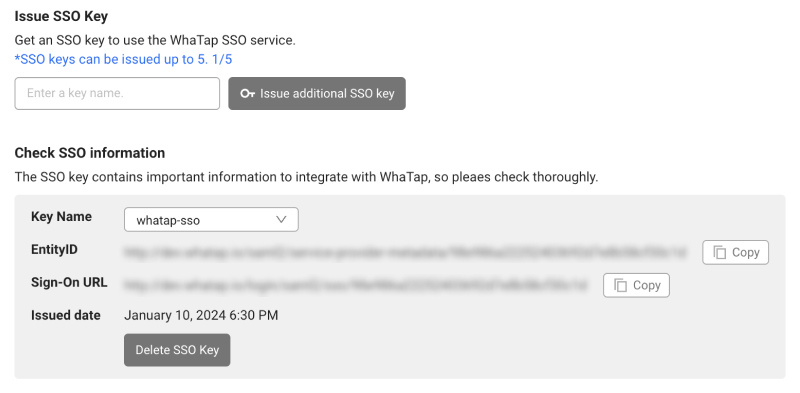
In addition, the SSO account link feature has been added. You can integrate WhaTap Monitoring with Okta that is a cloud-based user account management and access rights management solution. You can use the service after logging into the WhaTap service with the Okta account that is used in the organization.
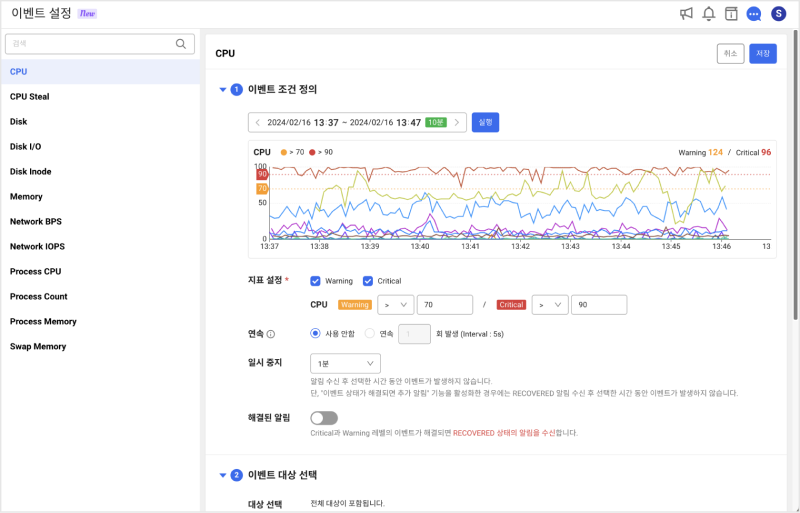
The Event Configuration New feature has enhanced the field-centric user experience by allowing users to select fields before categories, thus eliminating the mismatch between metrics perceived by users and event settings. The default event templates have been provided for your products, making it easier to configure the alert events.
The following overview guide helps you check new features and major changes in the Common section for Q1 2024, along with release versions.
Guide to new features and major changes
-
ChangedChanged the All Platform text to All Category when selecting a product while creating a project.Service 2.0.0 -
FeatureAdded the function to display the usage details when any usage value is clicked in My Usage > Invoice Preview.Service 2.0.0 -
ChangedIn Analysis > Metrics Chart, added the function to deselect all agents.Service 2.1.0 -
NewReorganized the side menus.Service 2.2.0 -
NewAdded the SSO account linking option.Service 2.2.0 -
ChangedIn Analysis > Metrics Search, changed the header to remain fixed when scrolling the table list.Service 2.3.0 -
ChangedAdjusted roles so that members with the Modify or Alert settings role can use the Maintenance Plan menu.Service 2.3.0
Flex board / Dashboard
-
ChangedIn Flex Board, modified the graph chart so that it does not continue when the ranks of the TopN widgets are updated.Service 2.0.0 -
ChangedModified to apply the Y Auto option for all Hitmap widgets by default.Service 2.0.0 -
FeatureIn Flex Board, added the function to adjust the length of decimal places in auxiliary charts.Service 2.0.0 -
ChangedIn Flex Board, added the chart legend settings in the Apdex widget.Service 2.1.0 -
ChangedModified to use the 5-minute and 1-hour statistical categories for the cloud-related metrics:aws_,azure_,ncloud_, andoci_.Service 2.2.0 -
FeatureAdded a widget button to go to the product's dashboard.Service 2.2.0 -
FeatureAdded the Merge multiple projects metric in the Apdex*100 widget on the dashboard.Service 2.2.0 -
FeatureAdded the group widget copying feature.Service 2.2.0 -
ChangedIn side_integratedFlexboard, improved the dashboard copying and sharing features.Service 2.3.0
Alert
-
ChangedIn Alert > Event Configuration, modified the essential input conditions to execute the Test alert function when adding a metric event.Service 2.0.0 -
FeatureIn Alert > Event History, added the following features.Service 2.1.0-
In the Event time column, added the function to display In progress and Occured during maintenance tags.
-
Added the option to display the Event resolution time column.
-
-
FeatureWhen adding or modifying the metrics events in Alert > Event Configuration, improved the visibility of the dark theme applied to the product logo for Category.Service 2.2.0 -
NewAdded the Event ConfigurationNewfunction.Service 2.2.0 -
ChangedAdded the Notification language option to set the default language for alert notification messages when creating projects.Service 2.3.0 -
FeatureIn Notifications, added the Opsgenie platform registration function as a 3rd party plug-in.Service 2.3.0 -
FeatureAdded the function to adjust the width of the project list.Service 2.3.14 -
FeatureIn Alert > Event ConfigurationNew, displayed the Event tab of the existing Event Settings menu, and added the JSON Batch Edit and JSON Batch Download functions.Service 2.3.14
-
For more information about the side menu reorganization, see the following.
-
For more information about the SSO account linking, see the following.
-
For more information about Event Configuration
New, see the following.
Application
Notable new features and changes in the Application product suite in Q1 2024 include the official release of the Go product, enhancements to Transaction Map, and improvements to the menu structures of Statistics and Instance Performance Management.
The Go application monitoring has started official service after ending the Beta version. WhaTap's Go application monitoring supports web frameworks and continuously collects the Go runtime package data. The call relationships are collected through link tracing in the MSA environment.
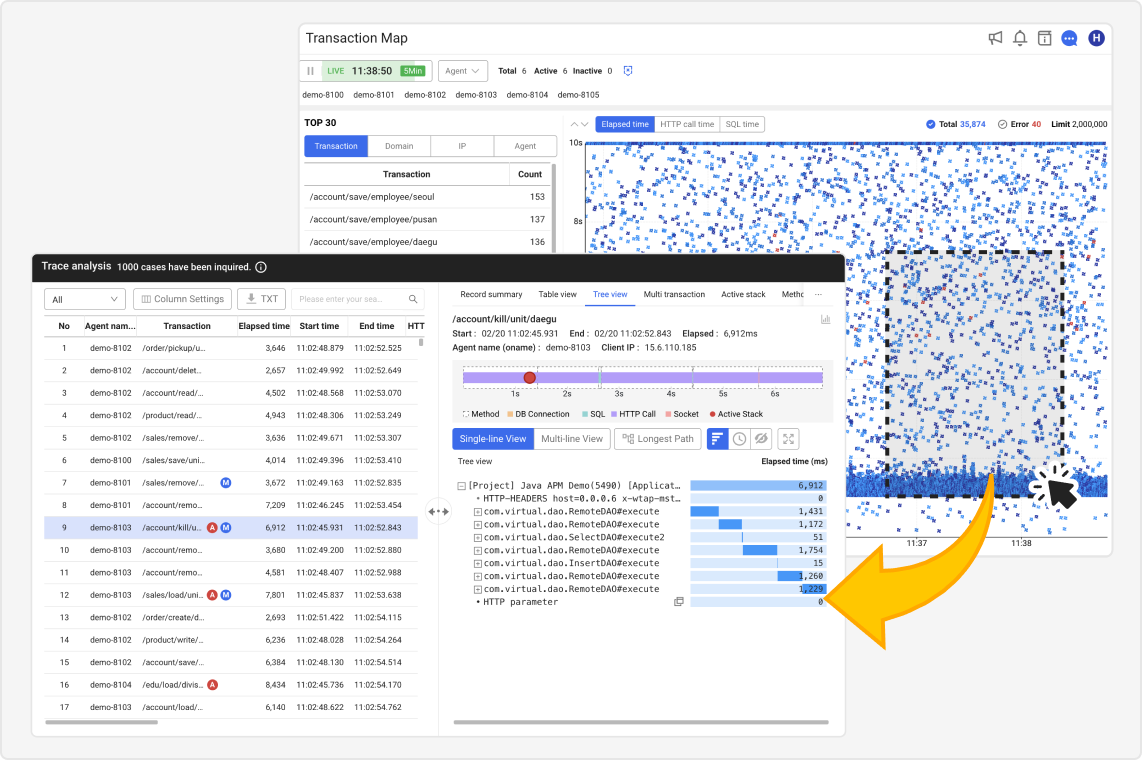
The Transaction Map menu allows you to check the detailed status of each transaction for a short period during a performance test or upon occurrence of a failure. Enhancements have been made to Transaction Map as follows.
Instead of removing the TX Trace section, the structure has been improved to provide detailed information through the Trace analysis popup window when dragging the chart. Additionally, the number of analyzed traces has been expanded from 100 to 1000, enabling analysis of 10 times more traces than before.
In addition, the Filter feature has been improved to minimize behaviors by applying filters on a single screen. For example, you can use transaction filters to filter and view only the selected transactions. In addition, overall convenience has been improved by allowing you to view data from up to 10 minutes, in addition to the previous real-time data inquiry of up to 5 minutes.
For Statistics and Instance Performance Management menus, improvements have been made in the work flow and stability, such as tab configuration for each menu into individual submenus.
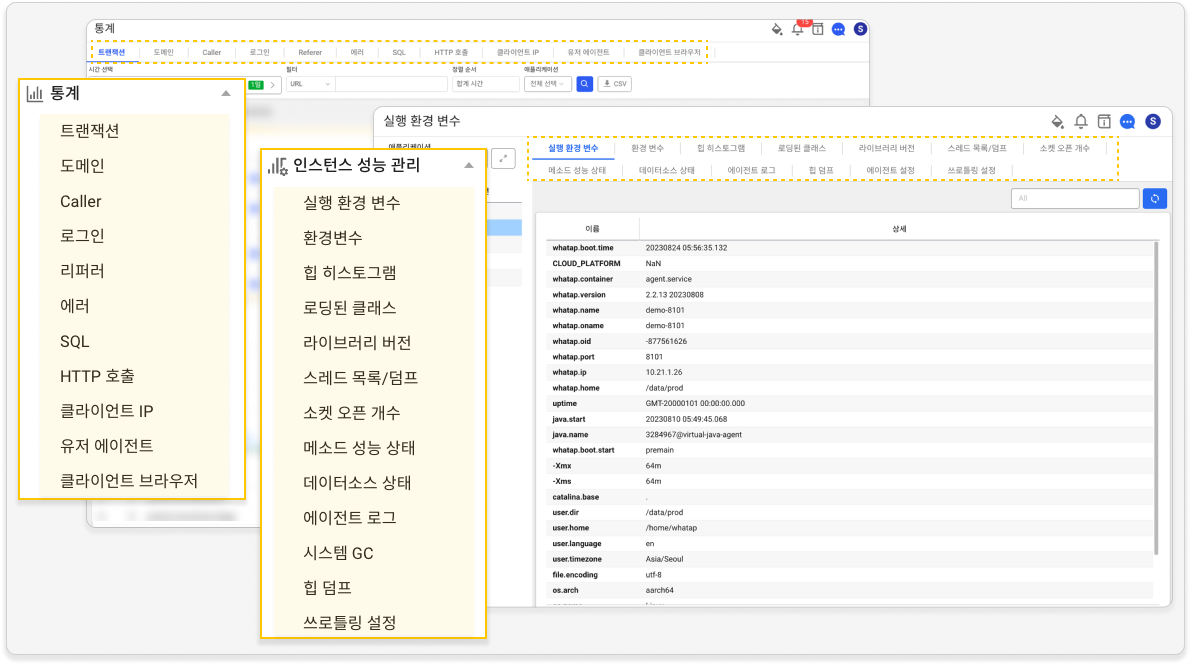
The following overview guide helps you check new features and major changes in the Application product suite for Q1 2024, along with release versions.
Guide to new features and major changes
-
FeatureReorganized the Dashboard > Transaction Map menu.Service 2.0.0- Deleted the TX trace section at the bottom of the screen.
- The detailed information is viewed through the Trace analysis pop-up window that appears by dragging the chart in the Transaction map section.
-
FeatureAdded the tooltips and related information and multilingual support to each widget in Application dashboard.Service 2.0.0 -
ChangedChanged the Node agent installation support version: 7.10.0 → 16.4.0.Service 2.0.0 -
ChangedIn the Multi-transaction tab of the Trace analysis window, added the function to save the project selection status.Service 2.1.0 -
ChangedIn the Multi-transaction tab of the Trace analysis window, added the function to save the chart and tree settings.Service 2.1.0 -
FeatureIn Table view on the Trace analysis window, added the SERIAL field in the modal that is activated by clicking the DB Connection and SQL steps.Service 2.2.9 -
ChangedIn Dashboard > Application dashboard, modified the design elements in the chart area (modified the widget title size, widget spacing, and chart section text size).Service 2.2.0 -
ChangedIn Dashboard > Application dashboard, added theAll APPS.tag in the Today's TPS and Today's visits widgets.Service 2.2.0 -
ChangedIn the Trace analysis window, improved the CRUD display format when checking the SQL details.Service 2.2.0 -
FeatureIn Dashboard > Transaction Map, applied a new UI with features reorganized.Service 2.2.0 -
NewLaunched theGomonitoring product's official service.Service 2.2.4 -
ChangedApplied a design system that configures the tab menu of the Statistics menu into individual submenus.Service 2.3.0 -
ChangedApplied a design system that configures the tab menu of the Instance Performance Management menu into individual submenus.Service 2.3.0 -
ChangedIn Statistics > Transaction, added SQL fetch countas Order By.Service 2.3.0 -
FeatureIn the Top 30 section of Dashboard > Transaction Map, added the features to add, delete, and filter for IP addresses in IP Filter.Service 2.3.0 -
FeatureAdded the Agent Active Transaction widget to display active transactions for each agent.Service 2.3.0 -
FeatureAdded the features to adjust the agent list spacing, add the search feature, and sort by name in order.Service 2.3.0
Agent guide
Java
Java Agent v2.2.26 January 11, 2024
-
FeatureTraces the reactor-kafka-1.3 in spring-boot-2.5 or later. -
FeatureTraces the RxJava schedules when using RxJava in spring-boot-2.5 or later. -
FeatureTraces RxJava3 schedules when using RxJava3 in spring-boot-3.0 or later. -
FeatureCollects and displaysthreadName,className,methodName, andlineNumberin the agent log. -
FeatureModified the agent log format. -
FeatureTracesCallableStatementof Tibero.
Java Agent v2.2.27 February 6, 2024
-
FeatureExpanded the mule-3.9.5 tracing range. -
Featurecamel-cxf-3.15 tracing -
FeatureAdded theOracleCallableStatementtracing. -
DeprecateRedis value collection is stopped when using the Lettuce driver.
Java Agent v2.2.28 February 27, 2024
-
FeatureWhen tracing the logback-1.2.8, added the appender exclusion option. -
DeprecatedStopped using the option to collect only the specified appenders while tracing the logback-1.2.8. -
FeatureWhen tracing the log4j-2.17, added the appender exclusion option. -
DeprecatedStopped using the option to collect only the specified appenders while tracing the log4j-2.17..
Java Agent v2.2.29 March 15, 2024
-
NewAdded the jboss-logging-3.3 log collection. -
FeatureAdded the SQL data collection when using thecom.mysql.cj.jdbc.ClientPreparedStatement.executeBatchInternalmethod. -
DeprecatedStopped collecting the HOSTNAME forenv.
PHP
PHP Agent v2.7.0 January 10, 2024
-
FeaturePHP 8.3 has been supported. -
FeatureTrace context (W3C) is supported in the multi-transaction tracing.
Python
Python Agent v1.6.2 March 29, 2024
FeatureAdded theexit_with_parent_process_enabledoption.
Node.js
Node.js Agent v0.4.86 January 4, 2024
FeatureAdded the agent options
Node.js Agent v0.4.90 February 5, 2024
FeatureAdded the agent setting options.
Node.js Agent v0.4.94 March 7, 2024
-
FeatureAdded the socket.io monitoring module. -
FeatureAdded the agent setting options.
Go
Go Agent v0.3.0 January 10, 2024
FeatureTrace context (W3C) is supported in the multi-transaction tracing.
Server
The Unix AIX installation package with notable new features and changes in Server products in Q1 2024 of WhaTap.
In this Q1, a new Unix AIX agent installation package has been provided. AIX, developed by IBM, is primarily used on enterprise servers. It is an operating system specifically designed for scalability, compatibility, and robustness in enterprise environments.
WhaTap supports AIX 6.1 or later. You can install the package simply by downloading it via the AIX installation package and running it. WhaTap Server Monitoring enables you to manage and monitor the AIX operating system more effectively.
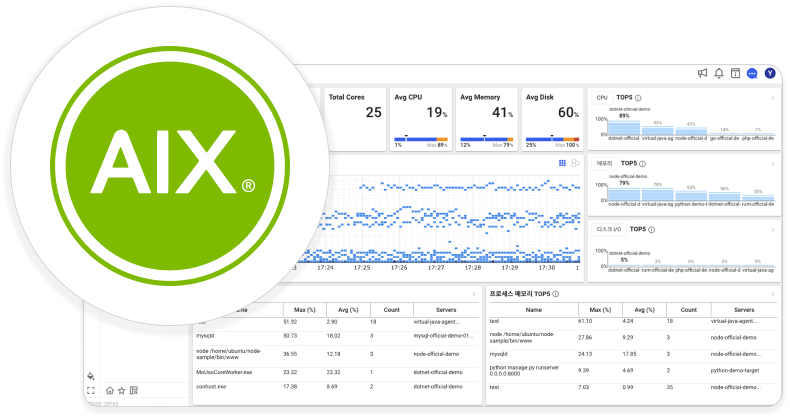
The following overview guide helps you check new features and major changes in the Server products in Q1 2024 along with release versions.
Guide to new features and major changes
-
ChangedIn Log > Log Configuration, modified to display theencodingitem for the agent configuration and script executables differently depending on the set language.Service 2.0.0 -
FeatureProvided the agent installation package and instructions for the AIX operating system.Service 2.2.0 -
ChangedIn Server List > Server Detail modified to use the Group by button on the upper right of the screen by the members with the Alert settings role.Service 2.3.7 -
FeatureAdded recipient tag setting function in the Log File / Window Event tab of the Event Configuration menu.Service 2.3.0
Agent guide
Server Agent v2.5.2 February 13, 2024
NewAmong the event logs of Windows, the events that meet the desired conditions can be collected as WhaTap logs.
Server Agent v2.5.4 March 11, 2024
NewAdded the time series monitoring through the result ofntpq -p, a server time synchronization command.
For more information about the AIX installation, see the following.
Kubernetes
Here are notable new features and changes in WhaTap's Q1 2024 Kubernetes products, including a new feature, Control Plane Monitoring, Kubernetes Agent List, Deployment List, reorganized feature, Pod Startup Analysis and Object Manifest, and support for newly added Helm chart installation.
WhaTap Kubernetes Monitoring has introduced Control Plane Monitoring in this Q1. The kube-apiserver Dashboard and kube-apiserver Metrics Search features have been added to provide visibility into kube-apiserver, the control plane component that manages the entire Kubernetes cluster and handles API requests in the cluster.
kube-apiserver Dashboard collects status and performance metrics of kube-apiserver, response times, throughputs, request failures, and such to monitor the availability and performance of the cluster. You can view the list of metrics collected by kube-apiserver via kube-apiserver Metrics Search.
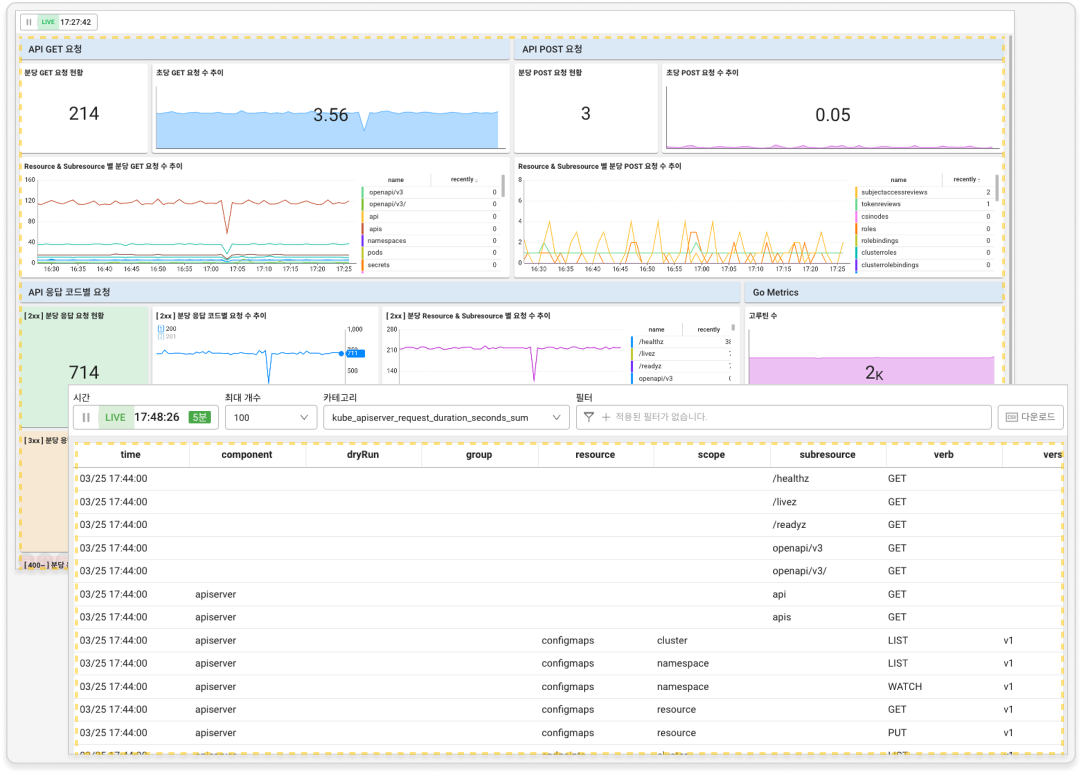
Additionally, the Deployment List feature that allows you to query information based on Deployment, and the Kubernetes Agent List feature that allows you to check the installation status of master and node agents, have been added.
Monitoring the collection of Pods rather than individual Pods is important for ensuring service stability and performance. In this sense, deployment monitoring that is responsible for application deployment and updates, is essential. In Deployment List, you can view resource relationships, status of pods, containers, and applications in the cluster, and key performance metrics such as CPU, memory, and number of transactions by Deployment.
Additionally, the newly added Kubernetes Agent List allows you to see the master and node agent installation status at a glance.
In addition, the Pod initialization performance and master meta information have been reorganized to provide Pod Startup Analysis and Object Manifest features. Pod Startup Analysis provides data details on the startup time and resource usage through precise analysis of the startup times for each Pod. Object Manifest adds historical view and comparison for each object, making it easy to trace changes in the cluster.
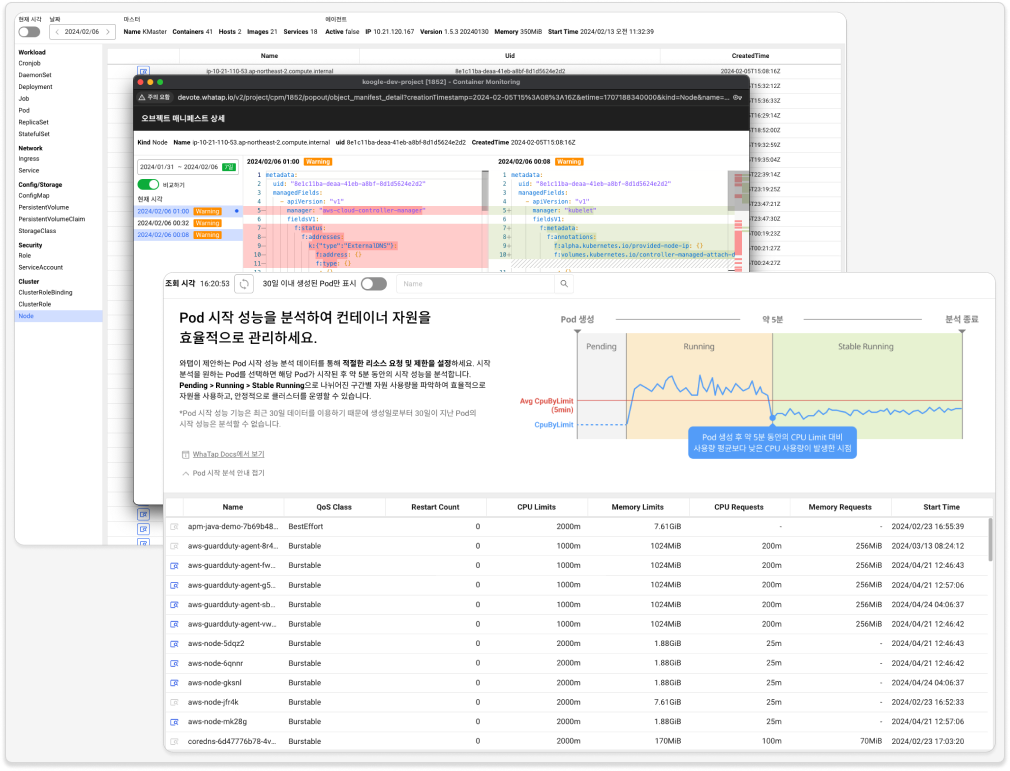
In addition, support of the Helm chart installation method that reduces the operation complexity when installing master and node agents has been officially supported, in addition to the previous method using the Yaml file.
The following overview guide helps you check new features and major changes in the Kubernetes products in Q1 2024 along with their release versions.
Guide to new features and major changes
-
ChangedReorganized the Analysis > POD initialization performance menu.Service 2.0.0 -
FeatureIf there is any linked project, provided the Correlation analysis view for the SQL target server and HTTPURLConnection information in Trace analysis > Table view.Service 2.0.0 -
FeatureAdded the Correlated Project Management menu under Management: Registration, view, and deletion of the linked projects.Service 2.0.0 -
ChangedIn Cluster Summary, added the Total Capacity CPU (total CPU for nodes) and Total Capacity Memory (total memory for nodes) widgets.Service 2.0.0 -
ChangedIn Performance Summary, added Number of containers running on nodes with agents and Number of pods running on nodes with agents, Number of nodes with agents widgets.Service 2.0.0 -
FeatureIn Container Images, added the metrics, - Total Container CPU and Total Container Memory.Service 2.0.0 -
FeatureIn Node List, added the metric, - beta.kubernetes.io/instance-type.Service 2.0.0 -
FeatureIn Cluster Summary, added the lists for Service, Ingress, Job, and CronJob objects.Service 2.0.0 -
FeatureIn Container List, added the function to move to the Node List menu that filters the nodes when the Node column is selected.Service 2.0.0 -
FeatureAdded the following menus under the Resource menu.Service 2.0.0- Pod List: The Pod list and information details are provided.
- Container Application List: The list and information details of the containerized applications are provided.
- Container Images: The list of images in use is provided.
-
FeatureAdded the function to filter only the selected resources when the status icon is selected at the top of the screen in the following menus:Service 2.0.0- Resource > Node list
- Resource > Container list
- Resource > Pod List
-
ChangedChanged the name of the Resource > Master meta information menu to Object Manifest.Service 2.1.0 -
FeatureIn Resource > Object Manifest, improved to search and compare the object manifests (supports Kubernetes agent v1.5.0 or later).Service 2.1.0 -
ChangedTo support Object Manifest, the master agent version has been changed to 1.5.2.Service 2.1.3 -
NewAdded the kube-apiserver Dashboard menu.Service 2.2.0 -
NewAdded the Kubernetes Agent List menu.Service 2.2.0 -
ChangedIn Cluster > Object Manifest, modified the UI design and added TOC for the Compare function.Service 2.2.0 -
ChangedWhen using the comparison feature in Container > Container List, added the Container CPU Usage chart in the Default and CPU tabs.Service 2.2.0 -
FeatureIn Dashboard > Container Map, added the ReplicationController grouping option.Service 2.2.0 -
NewAdded the kube-apiserver Metrics Search menu.Service 2.3.0 -
NewAdded the Deployment List menu.Service 2.3.0 -
FeatureAdded the Show containers created in less than 1 minute option in the Pod category.Service 2.3.0 -
FeatureIn Workload > Container Images, displayed the total number of images.Service 2.3.0 -
FeatureIn Cluster > Node List for the Kubernetes cluster project, added the node information column.Service 2.3.0 -
FeatureIn Integrated Container Map, added WhatapProject as the Group by option: grouping by project is possible.Service 2.3.0 -
FeatureIn Display Detail of Container Map, added the View only selected option that can display only the items selected from the target (container/Pod) list.Service 2.3.0 -
FeatureIn Workload > Container Application List, added the Call infomation tab in the application details.Service 2.3.0 -
FeatureIn Dashboard > Container Map, added the guide for the Pod phase and phases of the selected category.Service 2.3.0 -
FeatureIn Dashboard > Container Map, added the link to the list menu.Service 2.3.0 -
FeatureReorganized the Analysis > POD initialization performance menu and changed the menu name to Pod Startup Analysis.Service 2.3.0 -
FeatureIn Management > Agent Installation added the guide for agent installation using the Helm.Service 2.3.2
Log
-
FeatureAdded the Kubernetes Event menu to search Kubernetes events as a project basis.Service 2.0.0 -
FeatureAdded the log data search function in the WhaTap Event:#WhatapEventcategory.Service 2.0.0 -
FeatureIn Alert > Event Configuration, added the composite metrics event templates.Service 2.3.5
Agent guide
Kubernetes Agent v1.5.6 February 23, 2024
FeatureContainer > Container Volume, added the function to view the MountType property.
Kubernetes Agent v1.5.7 March 7, 2024
FeatureThe whatap-node-helper collects images and performance data from node disks and containers. After adding the logging and configuration functions for the container, you can handle the options of the corresponding function.
-
For more information about kube-apiserver Dashboard, see the following.
-
For more information about kube-apiserver Metrics Search, see the following.
-
For more information about Deployment List, see the following.
-
For more information about Kubernetes Agent List, see the following.
-
For more information about the Helm chart installation for master and node agents, see the following.
Database
WhaTap introduces notable new features and changes in the Database product suite in Q1 2024, including the launch of V2 for Redis and MongoDB products.
WhaTap's Database product suite is being transitioned to V2. Following the previous PostgreSQL and MySQL, Redis and MongoDB V2 services have been launched in this first quarter. The V2 features improved charting and collection features overall.
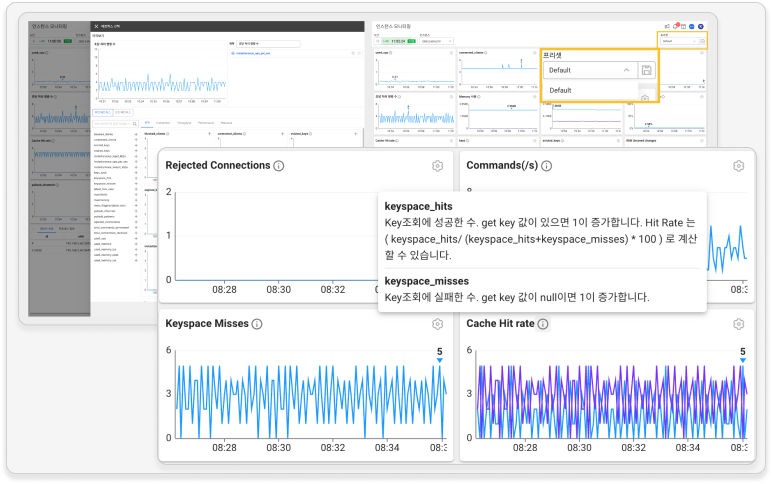
The UI and features of the Dashboard menu have been improved, and you can now directly check the database performance metrics from the menu. You can also select agents for each cluster in Monitoring Multiple Instances. And it provides the Log menu that allows you to search for database logs, check the trends, and receive log-related notifications.
With the transition to V2, the metrics divided into XOS and XOS2 are changed to percentage notation that can be checked as % and provided as an integrated version under *XOS.
The following overview guide helps you check new features and major changes in the Database product suite for Q1 2024, along with release versions.
Guide to new features and major changes
-
FeatureIn Analysis > Lock Tree, added the following features.Service 2.1.0- Added the query time unit and maximum value tag on the upper right of the Lock Wait Sessions widget.
- Added the function to display the unable-to-view message when searching for the data within 3 hours while the query period is within 1 month.
-
ChangedChanged the date on the pop-up guide regarding the end of project V1 support.Service 2.1.1 -
ChangedIn Dashboard > Monitoring a Database Instance, added the default presets (Default(rds), Default(xos)).Service 2.2.0 -
ChangedIn Dashboard > Monitoring a Database Instance / Monitoring Multiple Instances, modified to enable the Lock Tree in the table below if the chart of the Lock Wait Sessions widget is clicked.Service 2.2.0 -
FeatureAdded the function to display the session details when a column is clicked in the Lock Tree table in the following paths:Service 2.2.0- Dashboard > Instance monitoring
- Dashboard > Multiple instance monitoring
- Analysis > Lock tree
-
FeatureIn the Alert > Event Configuration > Database tab, the agent restoration notification function (Notify when event status is resolved.) has been added.Service 2.2.0 -
FeatureAdded a guidance for replacement of the XOS2 metric.Service 2.2.0 -
FeatureIn Agent Update, a new UI has been applied and features are reorganized.Service 2.0.0 -
FeatureIn Stat/Report > SQL Statistics, added the query preview when hovering the mouse over the query.Service 2.0.0 -
ChangedIn Management > Agent Installation, added considerations depending on the operating system when entering commands to create a DB user file.Service 2.2.0 -
FeatureIn Management > Agent list, added the DB IP column that displays the IP address of the database server.Service 2.2.0 -
ChangedApplied changes to the database product service for changing the xos metric (xos2 → xos).Service 2.3.0 -
FeatureIn Stat/Report > SQL Statistics, added the selection feature for multiple filters.Service 2.3.0 -
FeatureAdded the real-time/suspension inquiry and the refresh button to the Session detail window.Service 2.3.0 -
FeatureIn Dashboard > Flex board, added the active session table filter.Service 2.3.0
PostgreSQL / MySQL
-
ChangedIn Dashboard > Instance List, the agent update guidance message has been changed.Service 2.0.0 -
FeatureAdded the function to display the agent update guidance message in the header when the agent has been installed but it does not support theV2.Service 2.0.0 -
FeatureAdded the function to save the Y-axis values changed in the SQL Elapse Map and Slow Query widgets on the dashboard.Service 2.3.0 -
FeatureAdded the Default(xos), Default(rds) preset.Service 2.3.0 -
FeatureIn Dashboard > Monitoring Multiple Instances reorganized the functions.Service 2.3.0
PosgreSQL
-
FeatureAdded the function to check the configuration for column and index in the following menu paths:Service 2.0.0 -
FeatureIn Stat/Report > PG SQL Statistics, added the query preview when hovering the mouse over the query.Service 2.0.0 -
FeatureIn Analysis > Wait Analysis, added the function guidance modal.Service 2.0.0 -
FeatureIn Analysis > Wait Analysis, added the guidance modal for the agent configuration.Service 2.0.0 -
FeatureIn Analysis > Database Parameter, added unit notation to some values when displaying the Value column.Service 2.2.0 -
FeatureIn Stat/Report > PG SQL Statistics, added the selection feature for multiple filters.Service 2.3.0 -
FeatureIn Management > Agent Installation, improved its design and added the installation guide.Service 2.3.0
MySQL
-
FeatureIn Stat/Report > DB size, added the function to check the column and index lists when the TABLENAME column is clicked in the Table size (TOP 50) table.Service 2.2.0 -
FeatureAdded the plan search function in JSON format.Service 2.2.0 -
FeatureIn Stat/Report > MYSQL SQL Statistics, added the query preview when hovering the mouse over the query.Service 2.0.0 -
FeatureIn Stat/Report > MYSQL SQL Statistics, added the selection feature for multiple filters.Service 2.3.0
Redis
-
ChangedIn Management > Agent Installation, added descriptions for the uid.sh execution command that differ depending on the Redis version.Service 2.2.0 -
NewRedisV2service launchedService 2.3.0
MongoDB
-
FeatureIn Stat/Report > DB size reorganized the functions.Service 2.3.0 -
NewMongoDBV2service launchedService 2.3.0
Agent guide
DBX v1.6.18 January 25, 2024
Common
FeatureAddeduuidandstatefulsetto allow to receive a recovery message for database notification.
DBX v1.6.20 February 2, 2024
Common
FeatureAdded stateful to restore the database alarms.
Redis
FeatureAdded the Redis autoscale function.
DBX v1.6.23 February 20, 2024
MySQL
FeatureAdded the real-time search for the table layout.
DBX v1.6.30 February 29, 2024
FeatureAdded the event resolution notification feature.
DBX v1.6.33 March 13, 2024
PostgreSQL
FeatureAdded setup.sh in the agent configuration file.
DBX v1.6.35 March 15, 2024
PostgreSQL
FeatureAdded setup.bat in the agent configuration file.
DBX v1.7.0 March 25, 2024
MongoDB
FeatureAdded MongoDBV2
Redis
FeatureAdded RedisV2
Browser
Notable new features and changes to the Browser products in Q1 2024 include the User session analysis feature and Custom event collection feature.
A new feature in this Q1, User session analysis, can be used to check how users navigate web pages. By analyzing overall user behaviors--how they act, what pages they stay on, what elements they click on the screen, what errors occur on the screen, you can gain insights into how they use the service and get closer to understanding the behavioral patterns.
You can use User Session Log Search, AJAX Hitmap, and Page Load Hitmap to analyze users' on-page behaviors and trace various errors that occur in sessions. Session log information can be used to analyze end users' paths, causes for attrition, performance, and user experience. You can also use AJAX hitmap and Page Load Hitmap to identify users who are having issues in real time. This information allows us to check user experience with services and performance status.
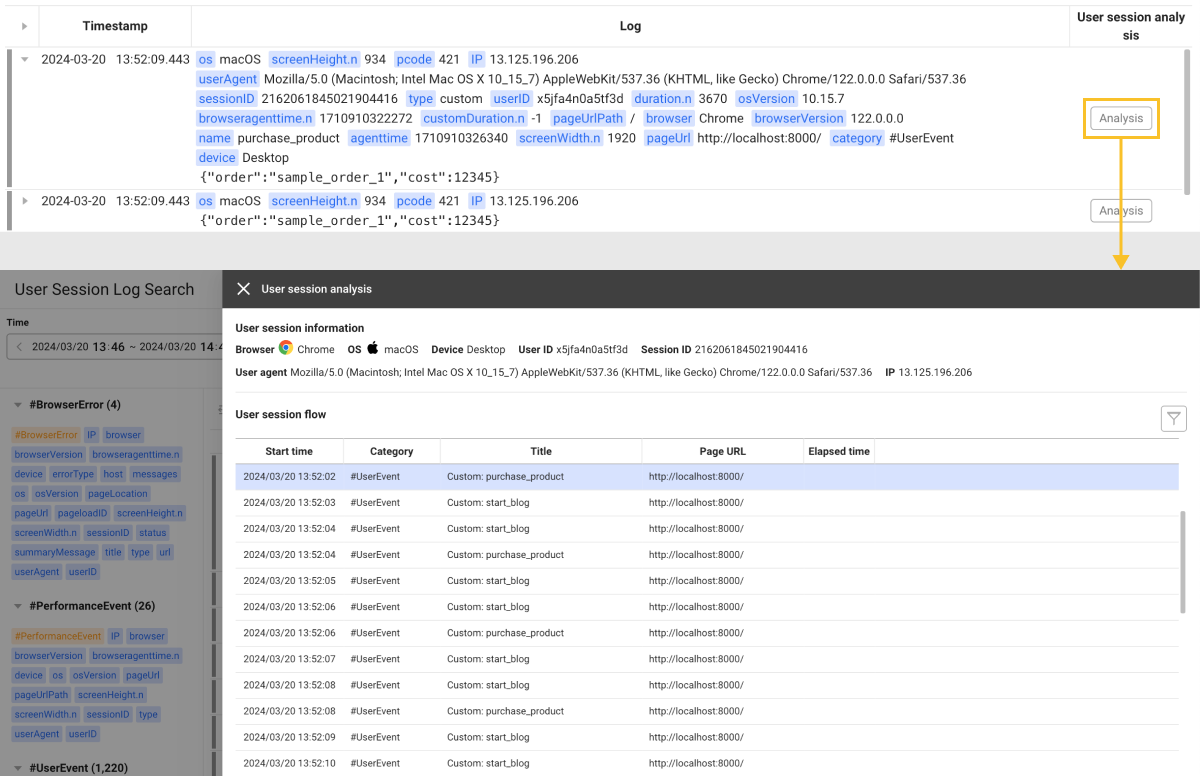
The Custom event collection feature provides an interface for users to collect desired events as well as basic information provided by Browser Monitoring. You can collect custom events using the addCustomEvent method among the interfaces provided by the browser agents, and then view the collected data through the User Session Log Search menu or Flex Board.
The following overview guide helps you understand new features and major changes in Browser products in Q1 2024, along with release versions.
Guide to new features and major changes
-
ChangedIn Dashboard > Browser Monitoring Dashboard, modified the map widget by default to display the country with the highest page load based on the lookup time.Service 2.0.0 -
FeatureAdded a filter to search based on the user ID in the following menus:Service 2.0.0 -
FeatureAdded the network status metrics for the AJAX hitmap data: Valid connection type, RTT, Valid bandwidth, Delivery TypeService 2.2.0 -
FeatureIn Analysis > Page Load Hitmap, added metrics in the resource data of the Page Load Detail window: Status code, Delivery TypeService 2.2.0 -
FeatureAdded the network status metrics in the page load hitmap data: Valid connection type, RTT, Valid bandwidthService 2.2.0 -
FeatureAdded the User session analyzing featureService 2.3.0 -
FeatureAdded the User Session Log Search menu that can search for user session logs.Service 2.3.0
Agent guide
Browser Agent v1.3.4 February 19, 2024
-
FeatureAdded the function to collect the following metrics in Network Information API upon occurrence of page load or AJAX events. -
FeatureAdded the function to collect the following metrics upon occurrence of resource events. -
FeatureAdded the function to collect Content Security Policy (CSP) errors.
Browser Agent v1.3.5 March 21, 2024
-
FeatureAdded the custom event collection interface. -
FeatureAdded the click event collection option.
Network
In the first quarter of 2024, WhaTap officially launched its Network Performance Monitoring product, which collects network data for processes to identify congestion and failures between networks and improve users' network performance.
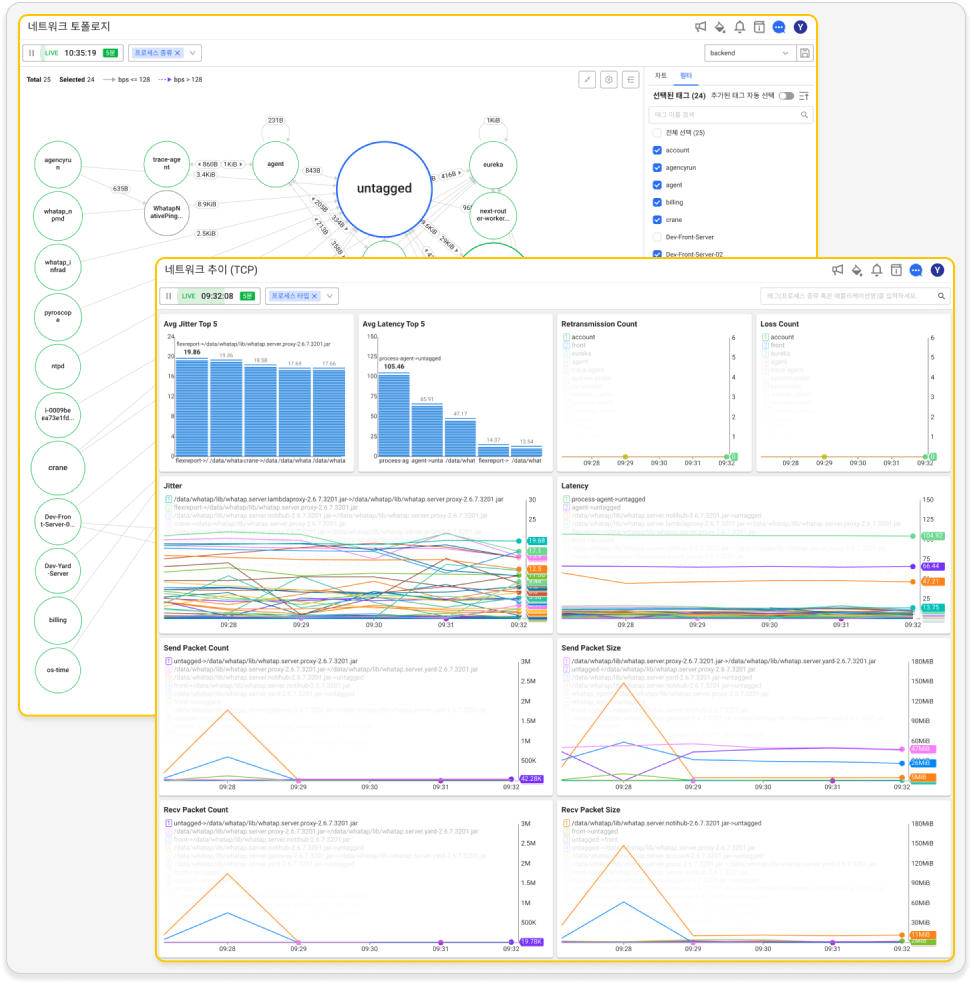
Recently, the network market is growing within the larger framework of cloud and virtualization. In addition to traditional equipment-centric network monitoring, the processes that perform tasks are becoming critical monitoring targets. With the WhaTap network performance monitoring, you can reliably monitor network metrics at the process level.
WhaTap's Network products trace the network behaviors performed by each process and visualize complex components and status information through the topology for intuitive understanding. You can view quality metrics (Latency and Jitter) and network usage metrics (bps, pps, and session count). Visibility has been obtained with tag options and various user custom charts have been provided through Flex Board.
The following overview guide helps you check new features and major changes in the Network products in Q1 2024 along with release versions.
Guide to new features and major changes
-
NewNetwork performance monitoring(NPM) service launchedService 2.1.7 -
ChangedIn Dashboard > Network Topology and Network Trend (TCP), modified to enable the real-time view for the last 5 minutes.Service 2.2.0 -
FeatureAdded the option to identify AWS resources when installing the agent.Service 2.2.0
-
For more information about the
Networkproduct, see the following. -
For more information about the agent options for AWS resource identification, see the following.
Log
WhaTap has introduced the reorganized Log search filtering feature with notable new features and changes to the Log product in Q1 2024.
The Log search filtering feature has been reorganized in Log Search and Live Tail. When entering a search value, you can check the search grammar supported through the guide UI, and the feature has been added to create and modify a tag through keyboard input and modify operators by clicking.
Additionally, if the agent option has been set, the feature to collect log levels (WARN, ERROR, FATAL) and display their colors on the left side of the log list has been added.

The following overview guide helps you understand new features and major changes in Log products in Q1 2024, along with release versions.
Guide to new features and major changes
-
FeatureAdded the function to display colors for log labels when the agent options have been set.Service 2.0.0 -
FeatureIn Alert > Event Configuration, enhanced to display the failure reason in a message when the API request has failed while adding or modifying a real-time log event.Service 2.0.0 -
FeatureIn Log search, Live Tail, reorganized the log search filtering function.Service 2.0.0 -
FeatureIn Log Trend, you can select values that are not in the Filter list by directly entering them.Service 2.1.0 -
ChangedIn Log, modified to share all the table settings of the project in Live Tail, Log search, and Log Trend.Service 2.2.0
