Using the browser monitoring
This guide explains how to quickly identify and respond to problems in your web applications that use the browser monitoring service. For the basic guide to the browser monitoring, see the following.
Analyzing the page load
The web page loading speed has a huge impact on user experience. When the pages are loaded slowly, users are more likely to leave your site and move to another site. This may cause users to miss the opportunities to view your pages and not to use or purchase your service or product.
Optimizing the page load speeds and improving user experiences are very important. Through page load analysis, you can identify what factors are slowing down your page loads and provide optimized user experiences by fixing problems. These efforts lead users to use your service or product more often for a long time.
Page load analysis is essential for operation of all websites and services. You can improve user experiences and achieve better business outcomes.
Viewing the browser application status
First check the page loading speed of your browser applications in Browser Monitoring Dashboard for the browser monitoring service.
For more information about Browser Monitoring Dashboard, see the following.
-
Checking the timeline widget
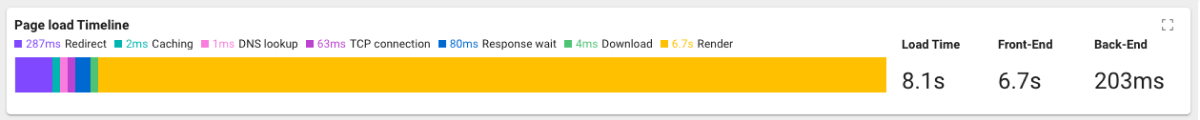
Through the Page Load Timeline widget, monitor the overall page load performance. You can see the overall performance of your browser applications in real time. You can see in which section the pages are loaded slowly.
-
Checking the page loading time and load count
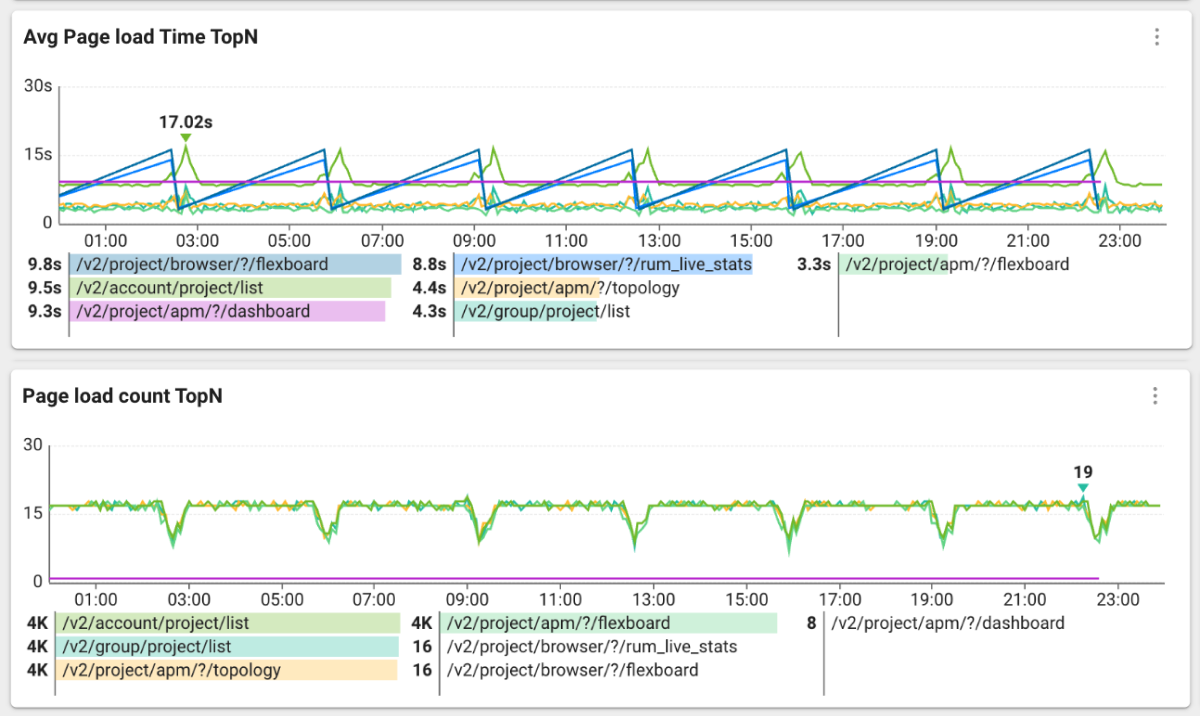
If a page accessed by many users takes long time to load, you can focus on improving the performance of the page. On the contrary, if a page shows a slow loading speed but its page traffic is not high, it can be more efficient to invest more development resources in other pages rather than improving the page.
-
Checking the page load hitmap
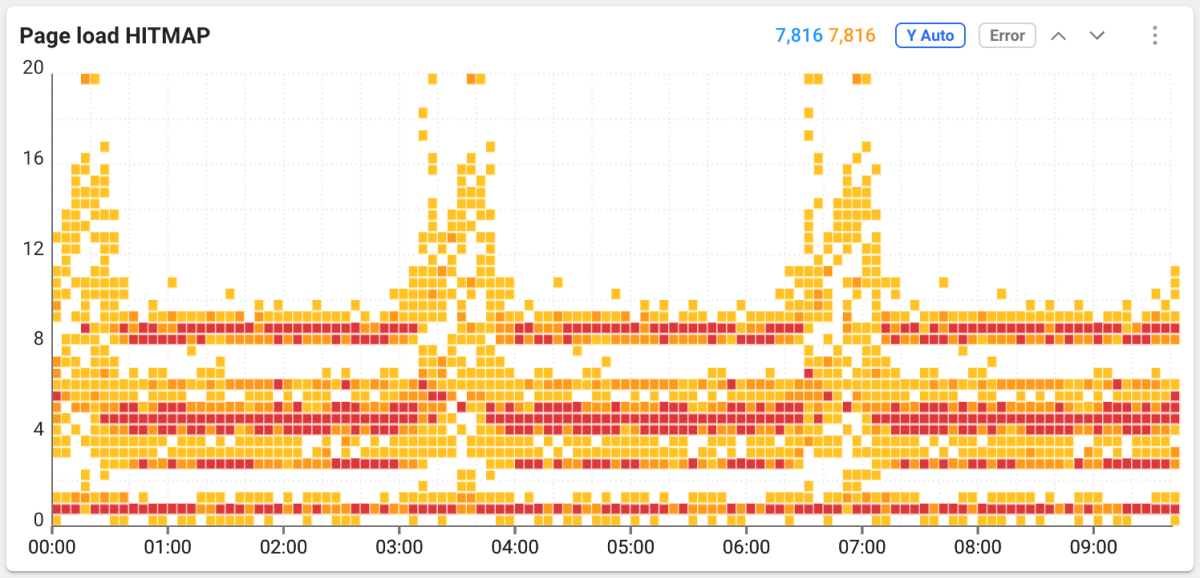
The page load events are provided with a hitmap chart. The page load events are displayed in real time. Slower page loads appear at the top of the chart.
Detecting and resolving the poor performance
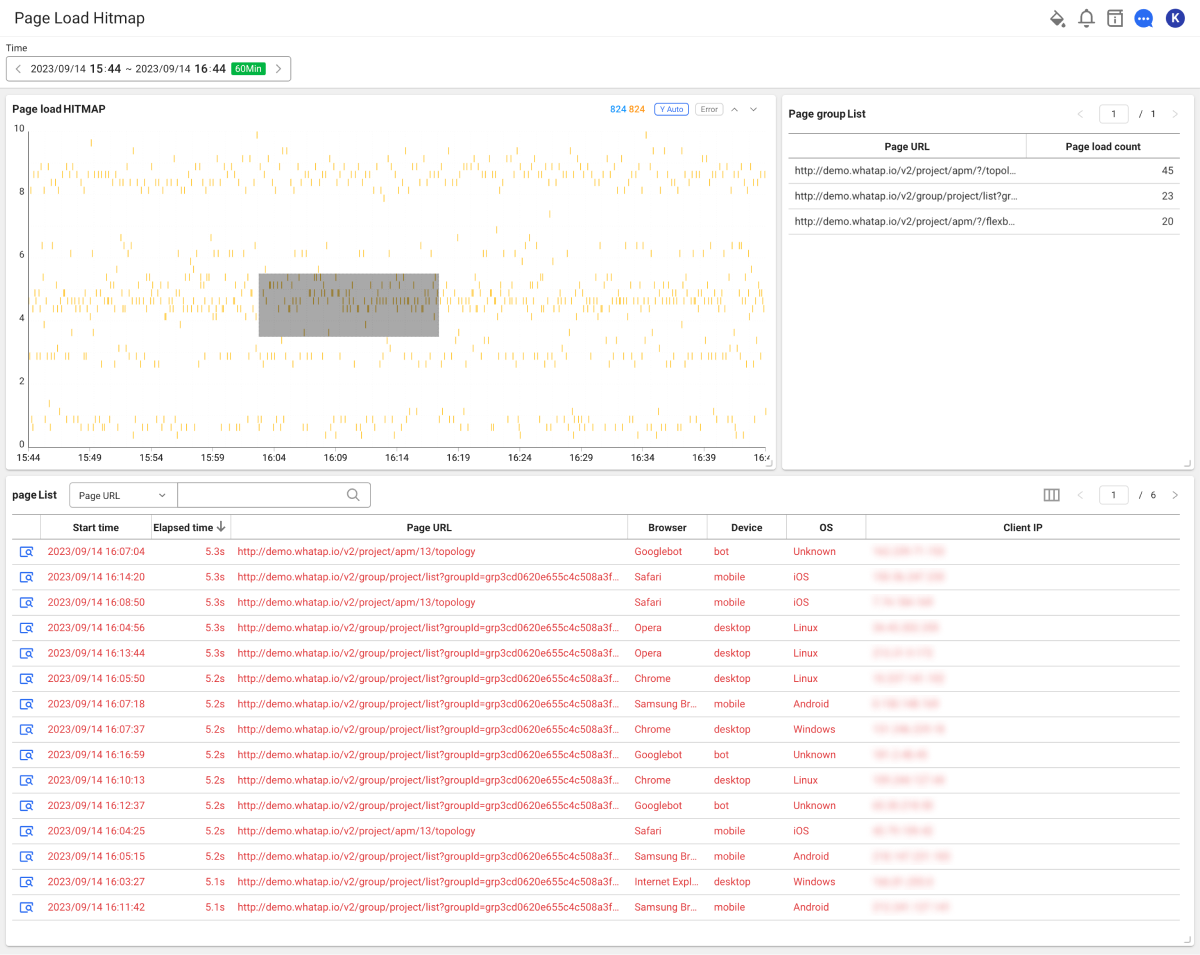
If you have identified any pages that are slow to load, you should find out the cause and fix it. Go to Analysis > Page Load Hitmap. Page Load Hitmap is a distribution chart of response times for page loads over time. You can get detailed information of individual page load events by checking the hitmap.
Checking the page load hitmap
-
Through Page Load Hitmap, check the browser application status.
You can identify the instances of high load at certain times or any slow page loading events. The events distributed at the top of the chart indicate they take long time to load and they are slow for browser application behaviors.
-
When dragging an area where the page loading is slow, check each page's load events in Page List.
In Page List, you can see the elapsed time, page URL, regional information, browser and device information, etc. It can be used to identify issues that occur in a specific environment or page.
-
You can also filter to see the pages with high average page loading times.
To see the page load events for a specific page, you can apply filtering in the page group list.
Viewing the page load details
If you select ![]() on the utmost left of Page List, the Page Load Detail window appears. You can identify various metrics to analyze the page loading performance and the factors that affect the performance.
on the utmost left of Page List, the Page Load Detail window appears. You can identify various metrics to analyze the page loading performance and the factors that affect the performance.
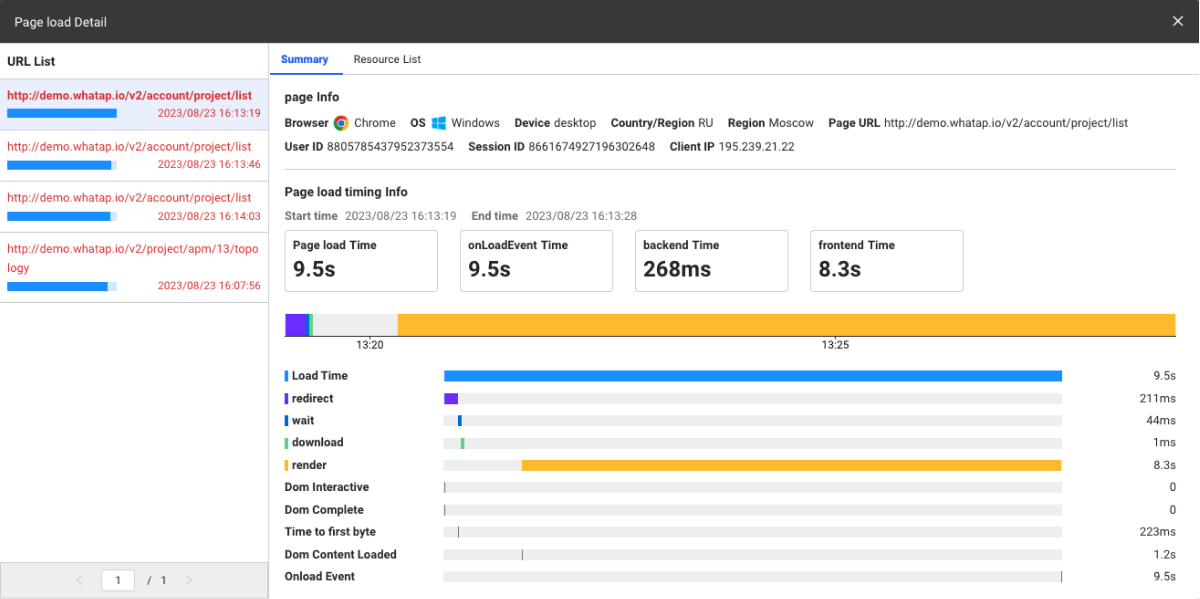
It provides the times spent for each section as a graph chart during the page load process. The chart helps you identify slow page load sections and optimize them.
-
Page Info: It provides the end users' access environment, access pages, user IDs, and session IDs. With this information, you can also determine anomalies that occur only in specific environments.
-
Page Load Timing: You can check the times elapsed for each section when loading pages. For more information about each section, see the following.
-
Redirect: The average amount of redirection time spent by the browser when loading web pages.
-
Caching: The average time spent by a browser to search cached resources while loading web pages.
-
DNS Lookup: The average time spent by a browser to look up website domains while loading web pages.
-
TCP Connection: The average TCP handshake time spent by a browser when loading web pages.
-
Response Wait: The average time spent from the browser sending network requests while fetching web pages to the first byte receptions from the server.
-
Download: The average time spent for a browser to download resources from the server while loading web pages.
-
Rendering: Average time spent rendering resources downloaded from the server to the screen and completing page load events.
-
Load Time: The average time spent for a browser to fully load web pages.
-
Front-End: Average time taken to initially render web pages.
-
Back-End: Average time taken to download resources by page load requests.
-
Optimizing in the back-end section
-
Optimizing Cache Settings: Caching speed may be slow if the cache settings of web pages are not optimized or the cache expiration time is too short. It is important to set appropriate cache expiration times for each content type.
-
Cache Miss: Caching may not work properly if there is a lot of unsaved content in the cache.
-
DNS Server Performance Issues: If your DNS server is under-performing or overloaded, DNS lookups may take longer. To resolve this, you can change to a faster and more reliable DNS server or use the load balance using multiple DNS servers. Alternatively, consider reducing the DNS lookup time by using few domains as possible and minimizing external resources.
-
Remote DNS Server Location: Lookup times may increase if the DNS server is too far away from you. You can resolve this by using geographically close DNS servers or by using a DNS service that provides the global cache.
-
Server Response Time: The response time may get slow if the server is slow or the server is under heavy load. Actions such as optimizing the server performance or increasing the server capacity may be required.
-
Server Location: Latency can get longer when the distance between the server and the user is far away. To resolve this, use a service such as Content Delivery Network (CDN) to provide content from a location closer to users.
-
Network Latency: A slow or unstable Internet connection may affect the loading speed in the backend section. This issue may differ depending on the network conditions.
-
File Size: Large files may slow the speed of downloading. Reduce the file size by optimizing and compressing resources such as images, scripts, and style sheets.
-
Concurrent Download Limitation: The browser limits the number of resources that can be downloaded simultaneously. To reduce the number of resources downloaded simultaneously, you can merge multiple resources into one or use an asynchronous loading technique.
Optimizing in the back-end section
-
Complex DOM Structure: If web pages have the complex document object model (DOM) structure, it may take a long time for the browser to render pages. Improve the rendering speed by simplifying your DOM structure and removing unnecessary nested elements.
-
Heavy CSS: If you use a lot of CSS rules and complex selectors, the browser can spend a lot of time calculating styles. Improve the rendering speed by optimizing CSS, simplifying rules, and removing unnecessary styles.
-
JavaScript Execution Delay: If a web page contains a lot of JavaScript codes or takes a long time to execute tasks, it may affect the rendering speed. Optimize your JavaScript code, reduce the execution time, and optionally use the asynchronous loading to improve the rendering speed.
-
Image Optimization: Heavy image files can slow down the rendering. Compress your images and optimize them to the proper size and format. Use the lazy loading technique to improve the rendering speed if needed.
-
Using web fonts: Web fonts can provide users with different font styles, but may affect the loading time. Optimize the web fonts and use only the required ones. You can also speed up the rendering by displaying text before font loading.
Checking the resource list
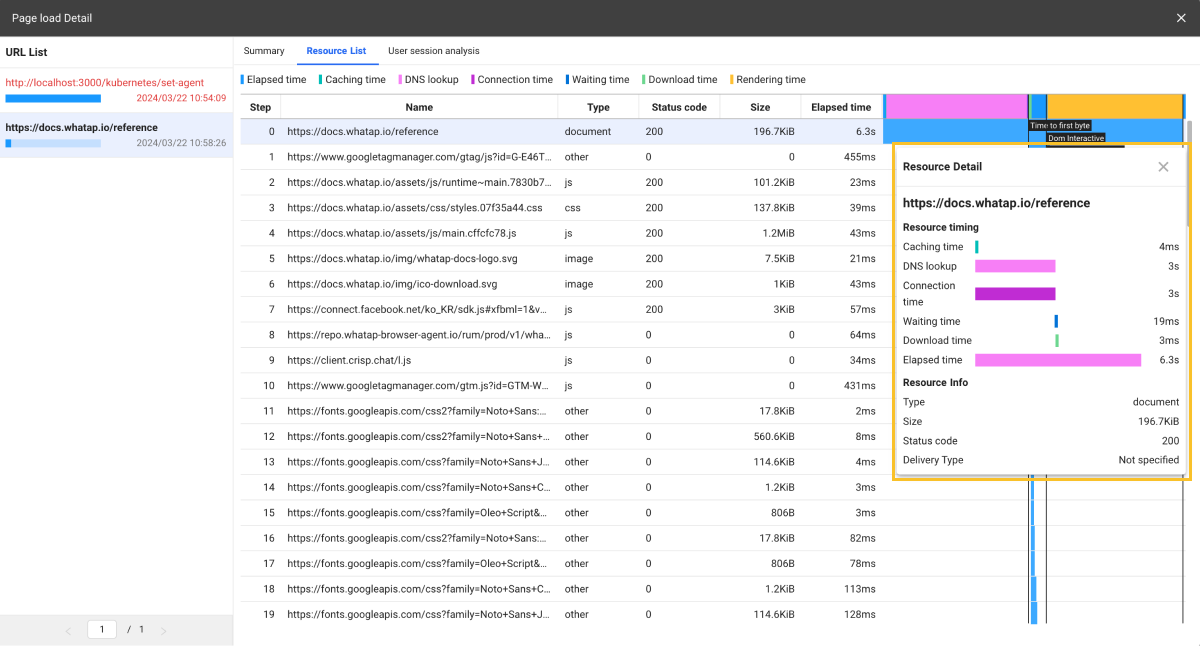
The resources downloaded from the server by the browser can significantly affect the page loading performance. The resource list in the Page Load Detail window lets you quickly identify the resources that are slow to load or have large file sizes.
We provide a timeline chart based on the start times for each resource so that you can identify which resources are loaded slowly. By seeing the file sizes of each resource, improve the performance impact. You can check the detailed time information through the Resource Detail window that appears when you select each resource.
AJAX Monitoring and Analysis
Asynchronous JavaScript and XML (AJAX) is a technology for updating web pages by exchanging data in an asynchronous manner. AJAX has advantages such as user experience improvement and reduction of requests to the server. However, AJAX requires monitoring because it has been implemented as JavaScript code running on the browser. AJAX monitoring is required for the following reasons:
-
To verify that AJAX requests have been handled properly
-
To check the performance degradation caused by AJAX requests
-
To determine whether AJAX requests are likely to cause security issues
-
To determine whether AJAX requests are wasting the network bandwidth
Checking the status of AJAX requests of browser applications
AJAX-related widgets in Browser Monitoring Dashboard provide a simple feature to check the status of AJAX requests from the browser applications.
-
Checking the AJAX response time
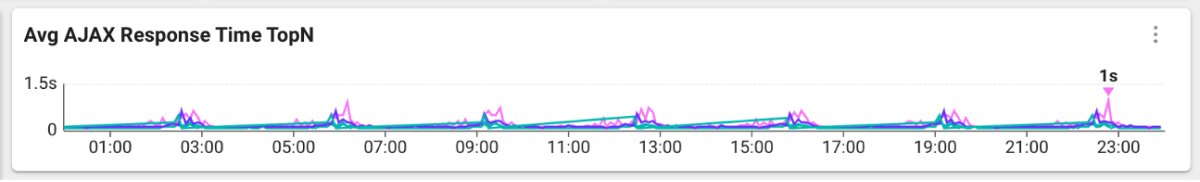
You can check the average load time of AJAX events from your browser applications. It is easy to identify the hosts or paths that take long time to load.
-
Checking the AJAX failure count
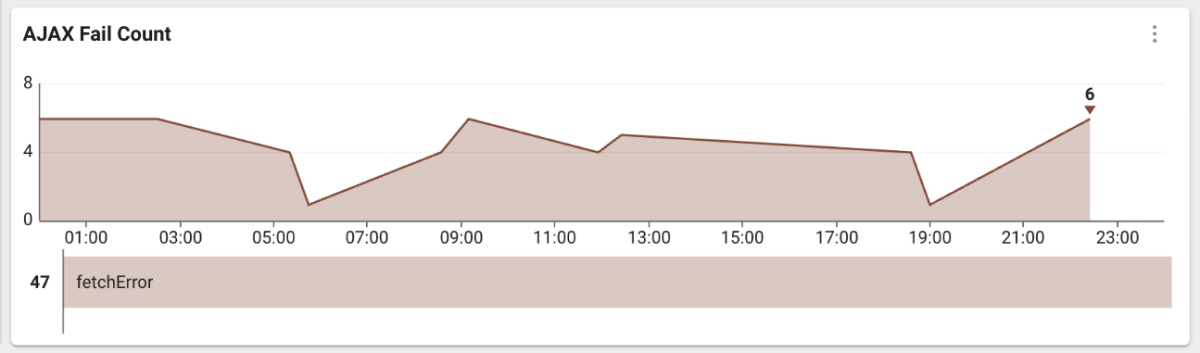
It is the number of AJAX requests not being made properly in the browser applications. You can get the real-time visibility into the number of AJAX failures occurring across the browser applications.
-
Checking the AJAX hitmap
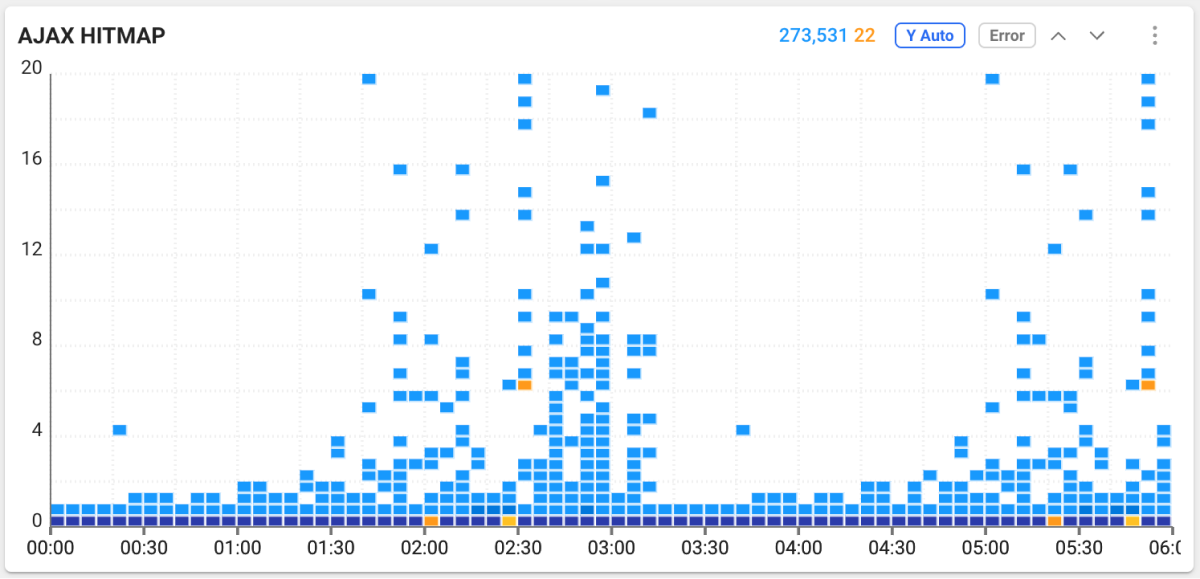
The AJAX requests are provided in a hitmap chart. It displays the AJAX requests occurred in real time. Slower AJAX events are located at the top of the chart, with problematic AJAX events highlighted in yellow.
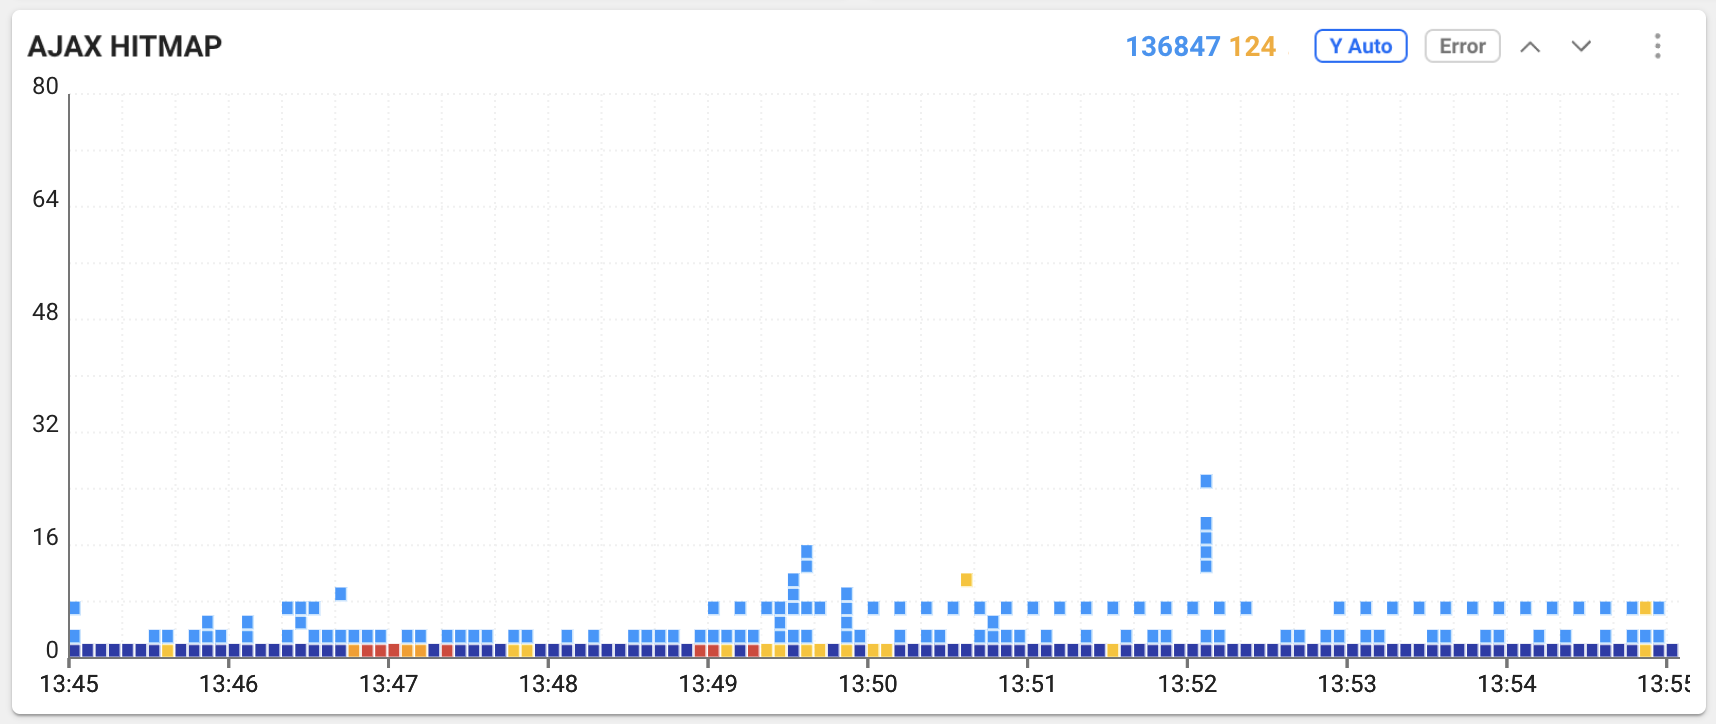
Identifying and resolving the slow performance by the AJAX hitmap
If any AJAX requests are slow or problematic, you need to check the status of each AJAX request.
Errors upon specific AJAX requests
Upon AJAX requests, if any response value is 400 or higher, or the request itself fails, it appears in yellow on the hitmap chart. When this color appears, you can guess that any of the following has occurred.
-
The server did not process any request due to a problem.
-
An improper request occurred in the JavaScript code.
-
The request failed due to authentication issues.
-
The server did not respond.
Bottleneck
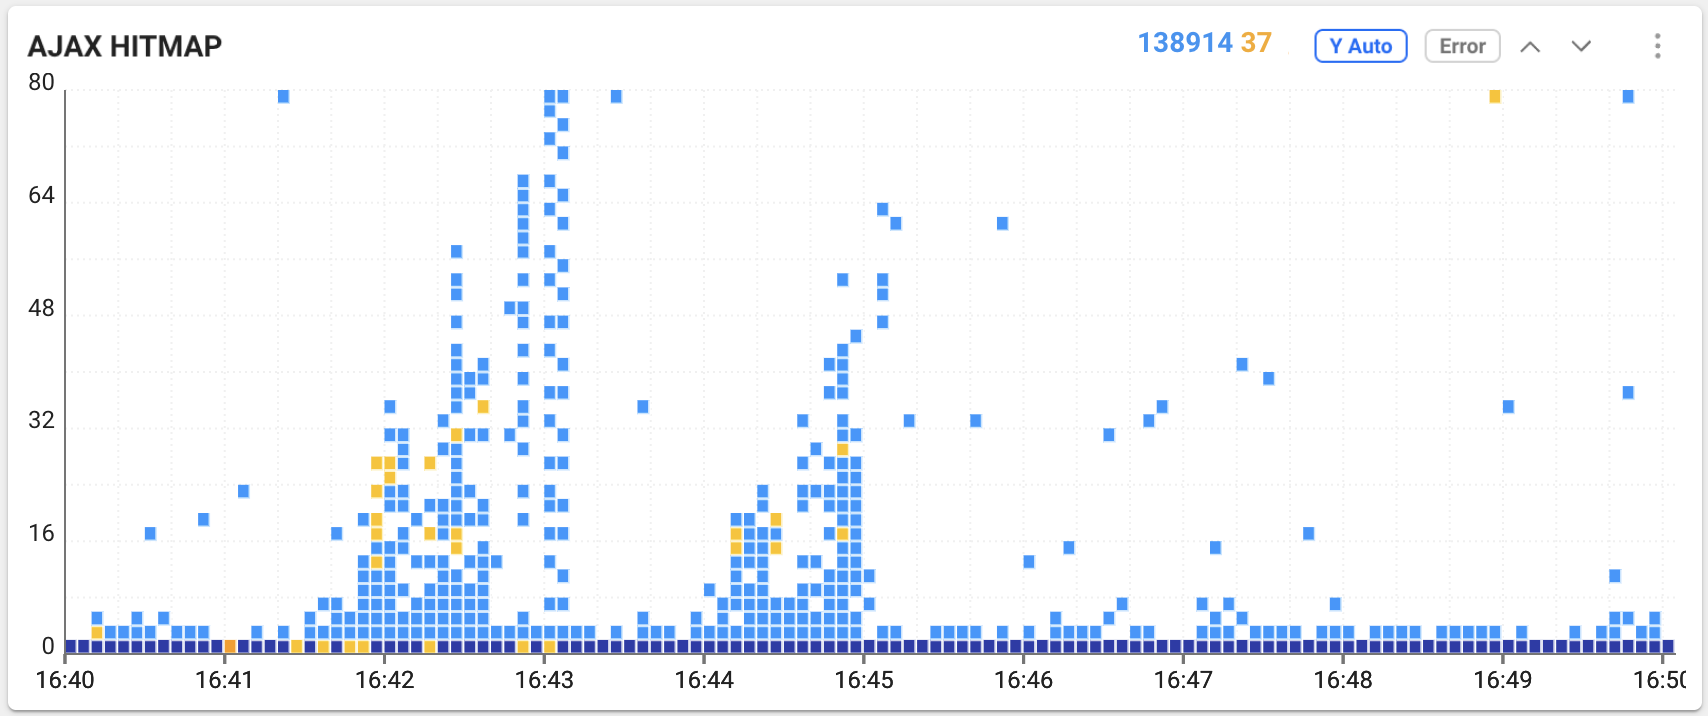
If you are experiencing bottlenecks in AJAX requests across browser applications, check the following situations.
-
Server Performance Limitation: A bottleneck can occur if the server side is limited in the number of requests that can be handled or the server has insufficient resources.
-
Concurrent request count limitation: A web browser has limitation in the number of requests that can be processed simultaneously. Too many concurrent requests can cause a bottleneck.
-
Large Data Transfer: If the size of the data to be sent or received is very large, the request processing can take too long, which causes a bottleneck.
-
JavaScript Execution Performance: A bottleneck can occur if the JavaScript code handling AJAX requests performs poorly or conflicts with other scripts.
-
Response Processing Delay: A bottleneck can occur if processing the responses received from the server takes a long time.
-
Network Bandwidth Limitation: If the Internet connection has a limited bandwidth, it can cause a bottleneck by limiting the number of requests that can be processed simultaneously.
Timeout
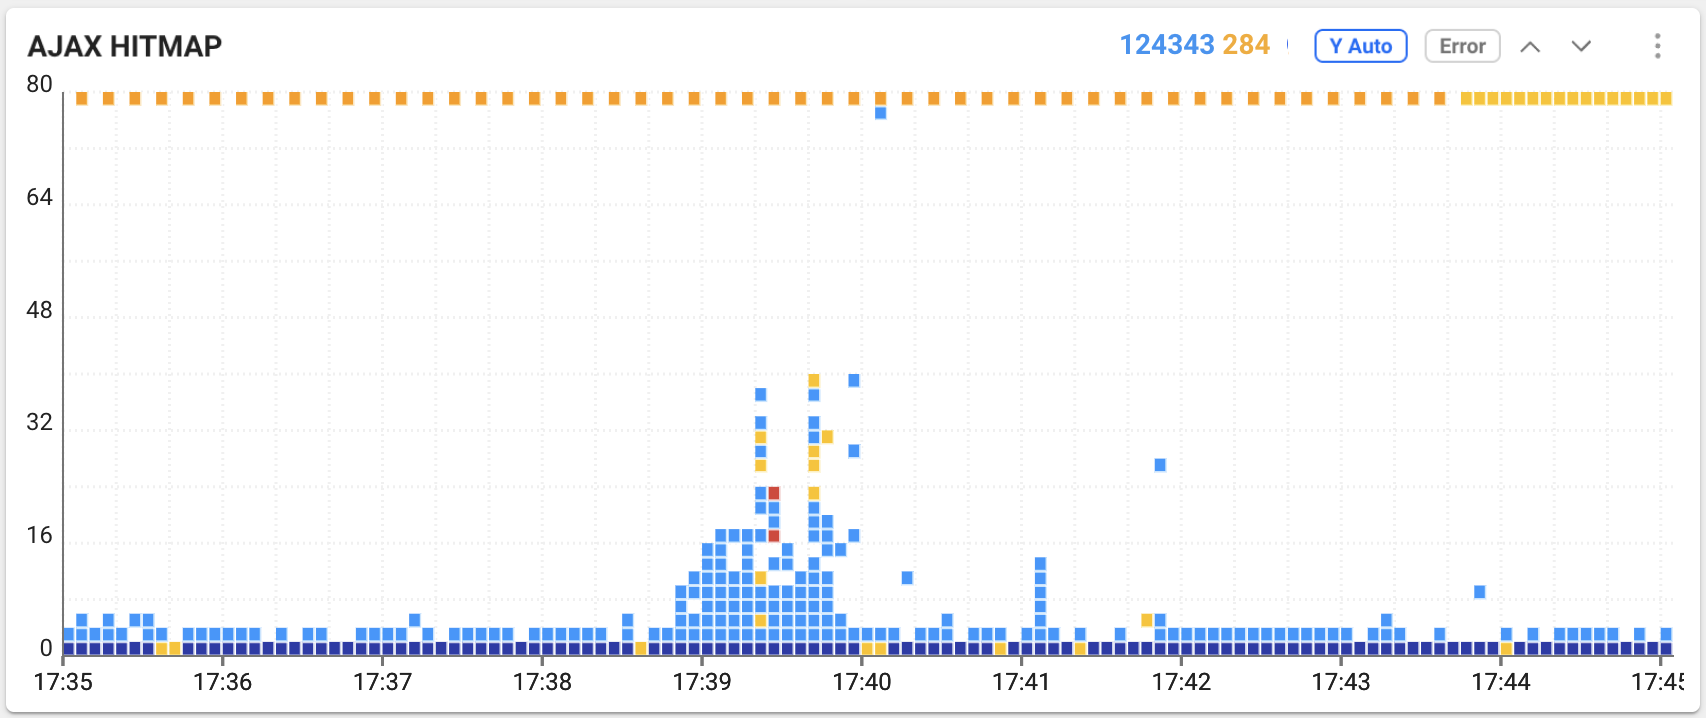
If you are experiencing a timeout in AJAX requests across browser applications, check the following situations.
-
Server Response Delay: Server-side process can take a long time, or a timeout can occur if the server is down.
-
Network Latency: If the Internet connection is unstable or delayed, AJAX requests may not be finished on time.
-
Request Processing Delay: A timeout can occur if the browser is delayed when processing requests.
-
Large Data: If the size of the data to be sent or received is very large, the request processing can take too long, which causes a timeout.
-
JavaScript Execution Error: A timeout can occur if the JavaScript code handling AJAX requests is problematic or conflicts with other scripts.
-
Browser Compatibility Issue: The error can occur only in specific browsers that have problems handling AJAX requests.
-
Request Timeout Setting: If you set a too low timeout value for AJAX requests, it may cause time out before the request completion.
Checking the AJAX information details
If you find that AJAX is slowing down the performance, check which AJAX request is causing problems on which page. If you drag a specific area of the chart in AJAX Hitmap, you can see the detailed information about AJAX of the selected area.
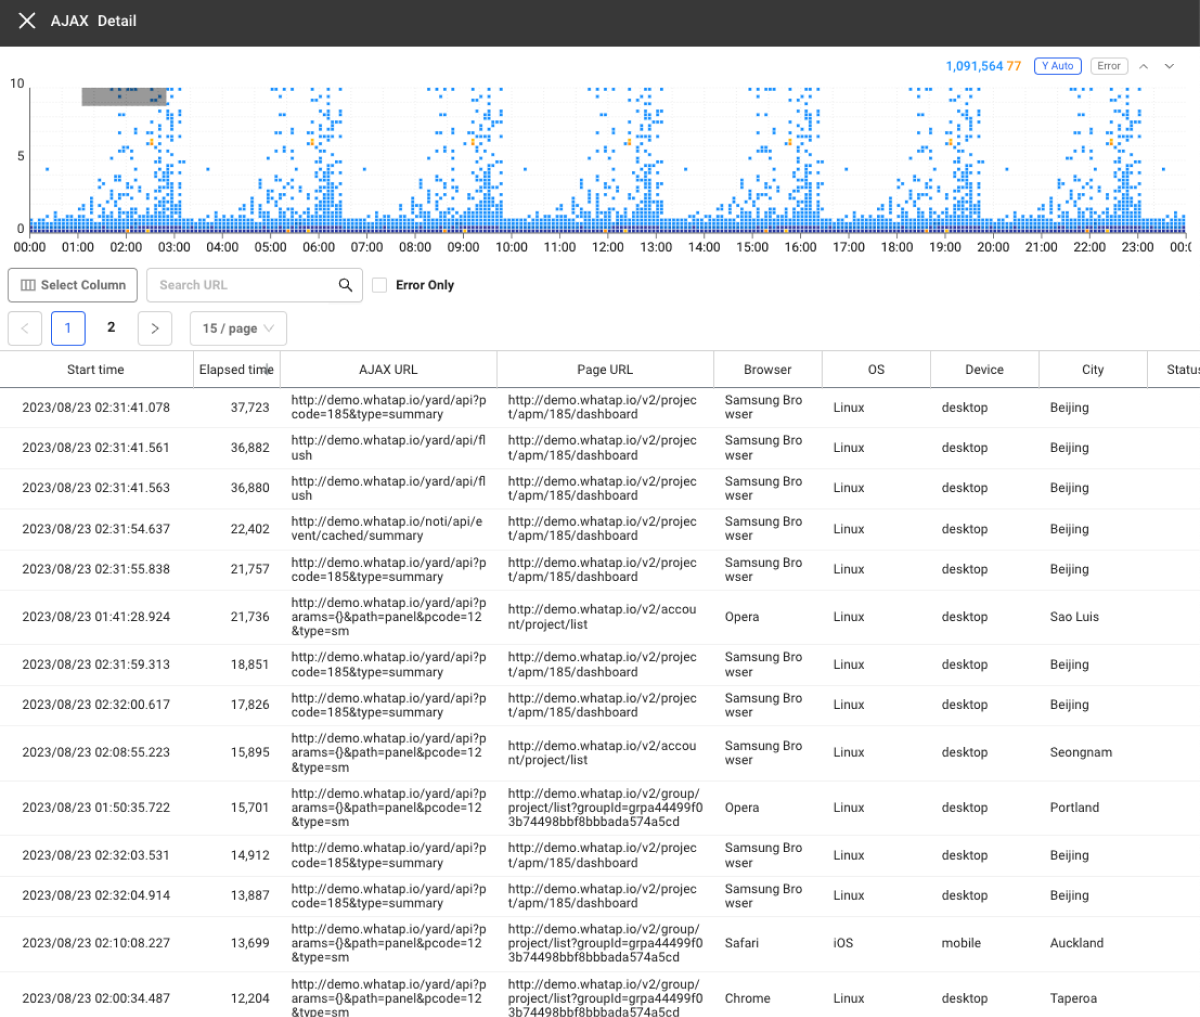
You can check the elapsed time of the AJAX request where a problem occurred, AJAX URL, page URL, browser, status code, and error message. The AJAX URL allows us to check which AJAX call caused the problem, and the browser information to determine in which environment users are experiencing the problem. Status codes and error messages are important because they can help determine the cause of any problem. Quick identification of the cause is a shortcut to problem resolution and service improvement.
User access environment analysis
User environments using the browser applications are diverse. It is almost impossible to develop browser applications for all browsers and access regions. Techniques should be applied to monitor, prevent, and minimize unforeseen problems.
To reliably provide browser applications to users, the following issues must be handled.
-
Troubleshooting the web browser and device compatibility issues: Because users use various browsers and devices, the compatibility issues may occur depending on the browser or device. Knowing the user's browsers and devices makes it easier to troubleshoot the issues with those browsers or devices.
-
Troubleshooting browser application performance differences by region: Depending on the connected region, the performance of the browser applications may be delayed due to different network speeds. This knowledge makes it easier to troubleshoot problems in the region.
Checking the user's connection environment
-
Checking the page load count by browser
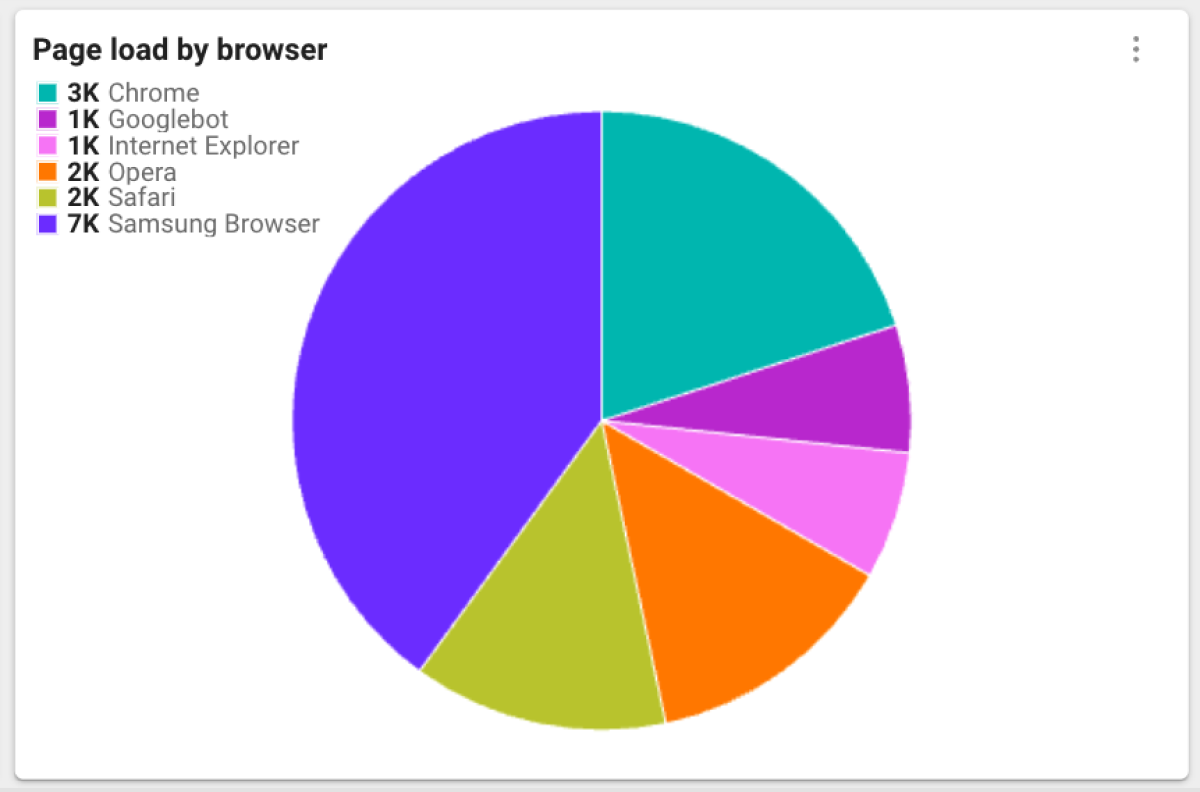
It provides the page load counts per browser for browser applications. This makes it easy to compare the page load performances for each browser.
-
Checking the error count per browser
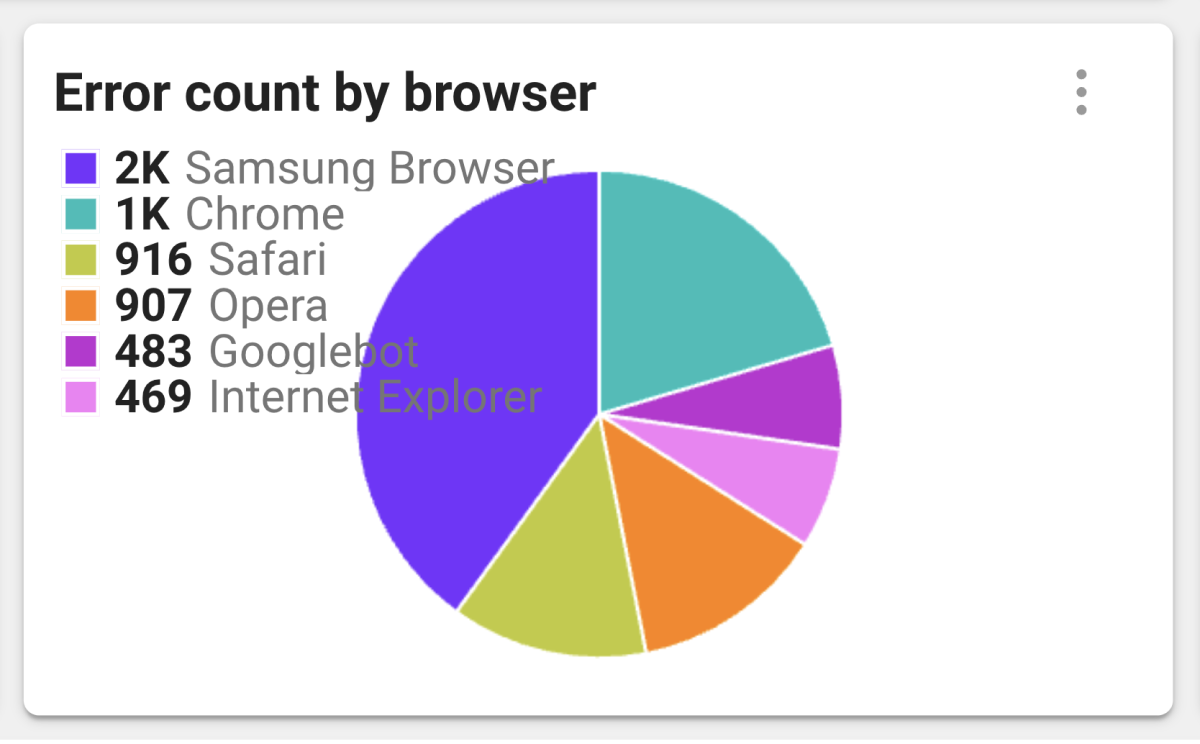
It displays the error counts for each browser in a pie chart. You can easily figure out which errors your browser is experiencing most often. If a specific browser has more errors than other browsers, the developer can proceed with optimization for the browser.
-
Checking the page load times and load counts by region
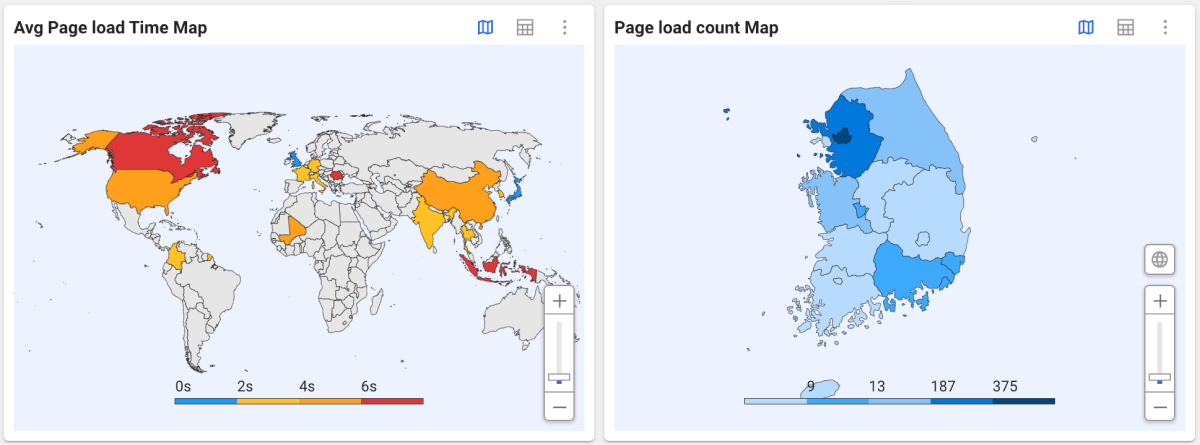
It provides the page load times and page load counts per region in a chart for browser applications. Users can easily compare the browser application performances by region. You can also find the way to improve your website's performance in areas where the page loading time is slow. For example, you can add servers in the areas where the loading time is slow or find the way to make cache more efficient. This allows users to enjoy the faster and more stable browser applications.
Detecting the cause of the poor performance
-
When loading resource files, the loading times differ depending on the browser. Find out what's slowing down your browser in Page Load Detail and check the following situations:
-
CSS Handling: Each browser uses different CSS handling methods, which can cause differences in the rendering speed. Because there are differences in the CSS properties or features supported by each browser, web pages should be implemented taking this into account.
-
Optimization Level: Different browsers may have different techniques for optimizing the page loading. Optimization operations such as image loading, code execution, and resource request order may work differently in different browsers.
-
Web page complexity: The complexity and components of the web page may show different performances in different browsers. Complex JavaScript code or CSS animations can cause performance degradation in some browsers.
-
-
If the errors occur only in a specific browser, check Web APIs and features support.
Due to differences in supporting web APIs and features across browsers, some features may work slowly or not work in some browsers. In this case, use a polyfill to replace the functionality or consider optimizing for the browser.
Error analysis
You must monitor browser errors for the following reasons.
-
Improving User Experience: Browser errors may prevent users from using the applications properly. Thus, monitor browser errors and fix them as quickly as possible.
-
Security Vulnerability Avoidance: Browser errors can be a major threat to the website security. You need to monitor errors and quickly fix security vulnerabilities.
-
Performance Improvement: Browser errors can degrade the application performance. Performance degradation is related to the service quality and user satisfaction. If the performance degradation continues, application users continue to decrease.
Checking the browser errors
In Dashboard > Browser Error, the errors from the browser applications are monitored. You can see the following error types.
For more information about Browser Errors, see the following.
-
Checking the error count per page
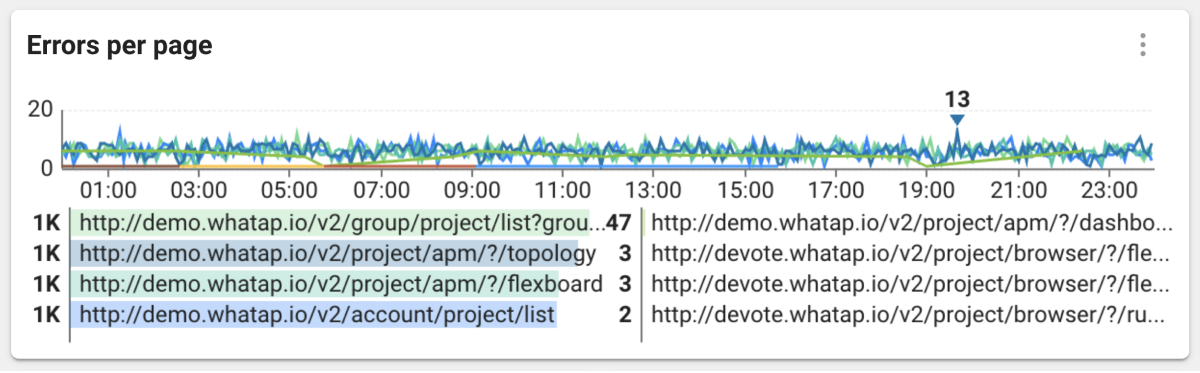
You can check the error counts for each page in real time. You can quickly identify and respond to problematic pages.
-
Checking the error count by type and AJAX error count
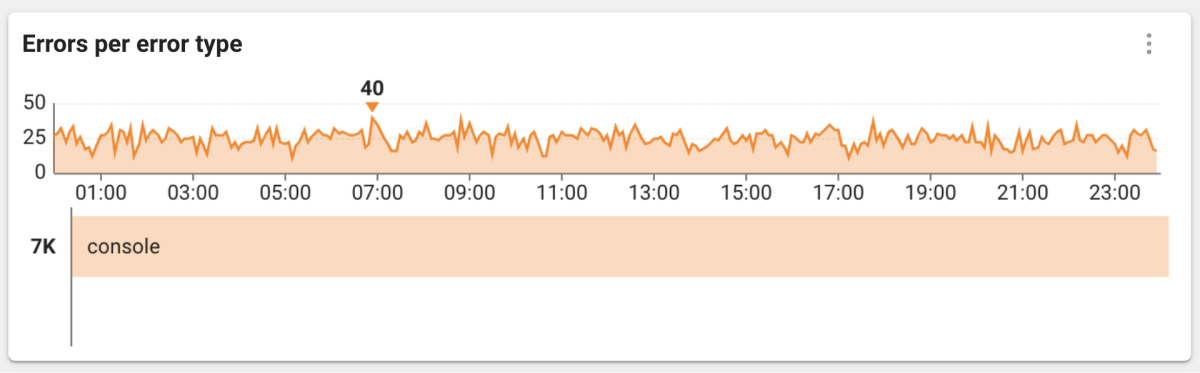
You can check the number of errors occurring across the browser applications by error type.
-
Checking the error count per browser
It displays the error counts for each browser in a pie chart. You can easily figure out which errors your browser is experiencing most often. If a specific browser has more errors than other browsers, the developer can proceed with optimization for the browser.
-
Checking the error message table
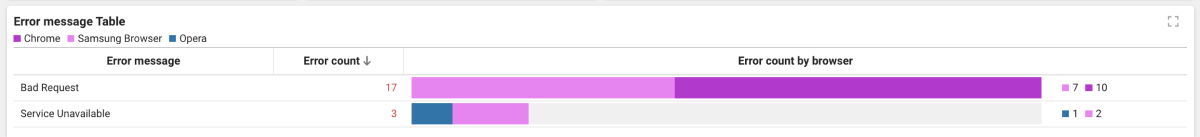
It displays the error counts by error message and the error counts by browser in a table. You can find which browsers are causing most errors and use them to troubleshoot. It is also useful for identifying the root causes of errors. If a new error occurs, you can quickly respond by seeing this table.
Finding the error cause
If you find an error message and the caused page, check its details in Analysis > Track Error.
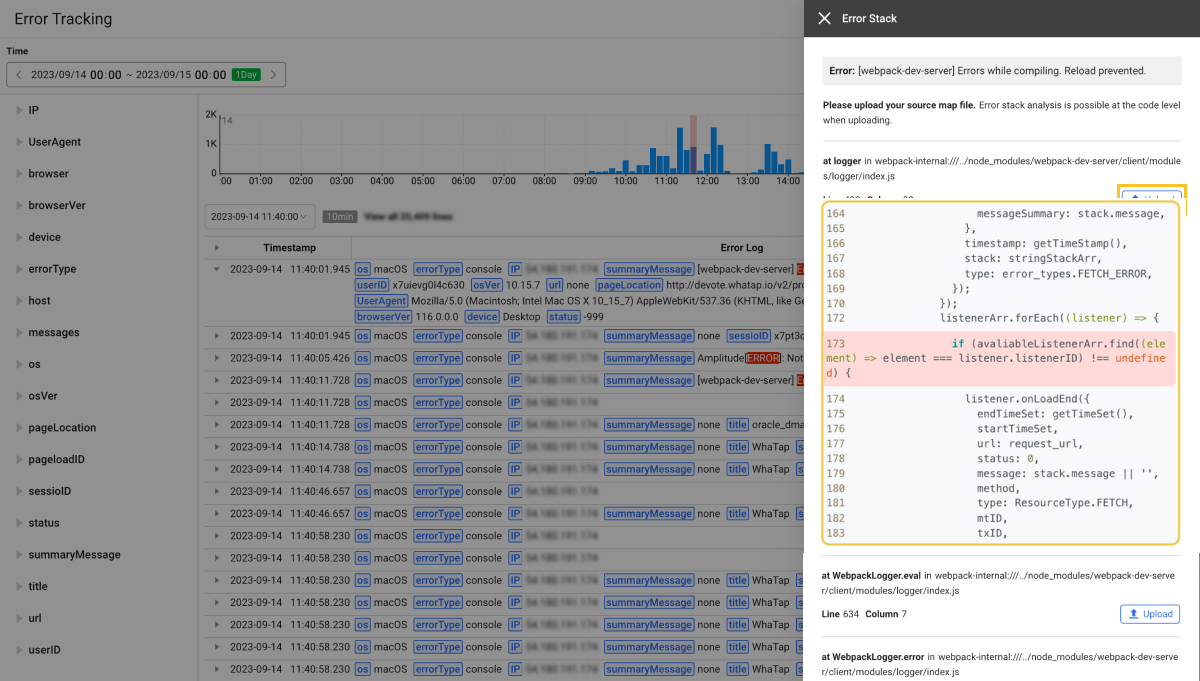
In Track Error, you can see the error details generated from browsers. You can also search by applying filters to pages or error messages. Errors generated by users include the user environment information (browser, OS, device), error stack information, and page information.
To determine the cause of an error, it is recommended to proceed with the following steps.
-
Read the error message to see which task has been performed on the page.
-
Take a look at the code and libraries used on the page.
-
Use the error stack information to determine which function or library caused the error.
-
Use the browser, OS, and device information to check if the error only occurred in a specific environment.
-
Use the page information to check if the error occurred only in a specific part of the webpage.
After identifying the cause of the error, fix it as quickly as possible. You can improve user experiences and avoid security vulnerabilities in the browser applications.