Setting the DB metrics alert
The following explains how to configure a metrics alert for database projects. You can set alerts based on the key metrics relating the database performance and quickly recognize potential problems.
Configuring the process alert
While running databases, their processes may terminate unexpectedly. When any process running on the database is terminated, an alert is sent to users to quickly respond to the problem.
XOS agent configuration
Before adding a metrics event, add the following options in the XOS agent configuration file (xos.conf). The following example shows how to set the top and lock.sh processes as monitoring targets. Multiple processes can be registered using comma (,) as the delimiter.
process=top,lock.sh
Adding the metrics event
This example shows how to set to send an alert when any process monitoring target set in the XOS agent (xos.conf) is terminated.
-
Under the user database project, go to Alert > Event setting.
-
Select the Metrics tab.
-
Select + Add Alert Policy.
-
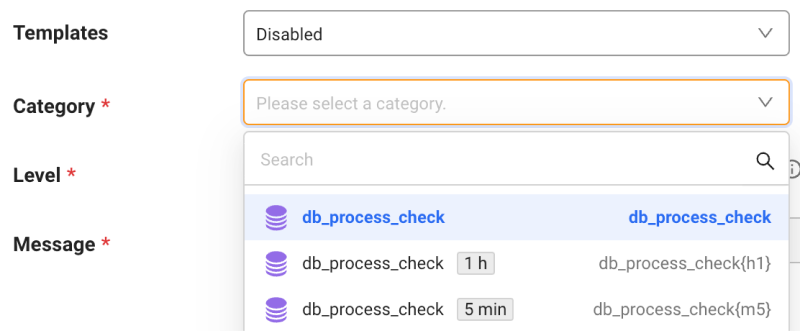
If the Metrics event window appears, enter the event name.
-
In Category, select the db_process_check item.
-
In Level, select an alert level.
-
In Message, enter the alert message. You can apply any variables to messages by entering the tags or field keys.
(e.g.
${oname},${count},${process_name}) -
Enter desired values from the following cases into Event rule.
-
In case any of top and lock.shprocesses is terminated:
process_name == 'top' || process_name == 'lock.sh'
-
In case multiple processes are terminated among monitoring targets in the xos.conf file:
count >= 2
-
In case multiple processes among the monitoring targets set in the xos.conf file are terminated or the lock.sh process is terminated:
process_name == 'lock.sh' || count >= 2
-
-
After all entries are made, select Save.
-
To send an alert when the event condition has been resolved, select the Additional notifications when the event state is resolved. option.
-
Tags or field keys can be seen in Sitemap > Metrics search.
-
For more information about the Metrics alert for database projects, see the following.