WhaTap Monitoring for DX-IT operation
As today’s IT environment evolves rapidly, so the demand for IT operation and monitoring changes drastically. The proliferation of the Digital Transformation (DX) and cloud technology has increased the complexity of IT infrastructure, which has made it difficult for the existing monitoring method to catch up with such change. This document provides Integrated Monitoring and Real-Time Observability as the best practices for the main challenges that IT monitoring faces, as well as a methodology to implement DX-IT operation.
Challenges of IT monitoring
Changes in IT environment
Today’s IT environment changes rapidly due to the Digital Transformation (DX) and evolution of technology. These changes require companies to reconstruct and optimize the ways IT operates to achieve their business goals.
Effect of Digital Transformation (DX)
Digital transformation is a process to reconstruct the existing business models and create new values using technologies. Technologies such as cloud, artificial intelligence (AI), big data, and blockchain support companies in getting ahead of the competition through digital innovation.

-
Technology-based innovation: technologies, such as cloud service, IoT, and virtual reality (VR), increase the efficiency of business and create new market opportunities.
-
Introduction of new business model: DX enhances the competitiveness of companies by innovating the existing legacy system and introducing a new business model.
Evolution of IT technologies
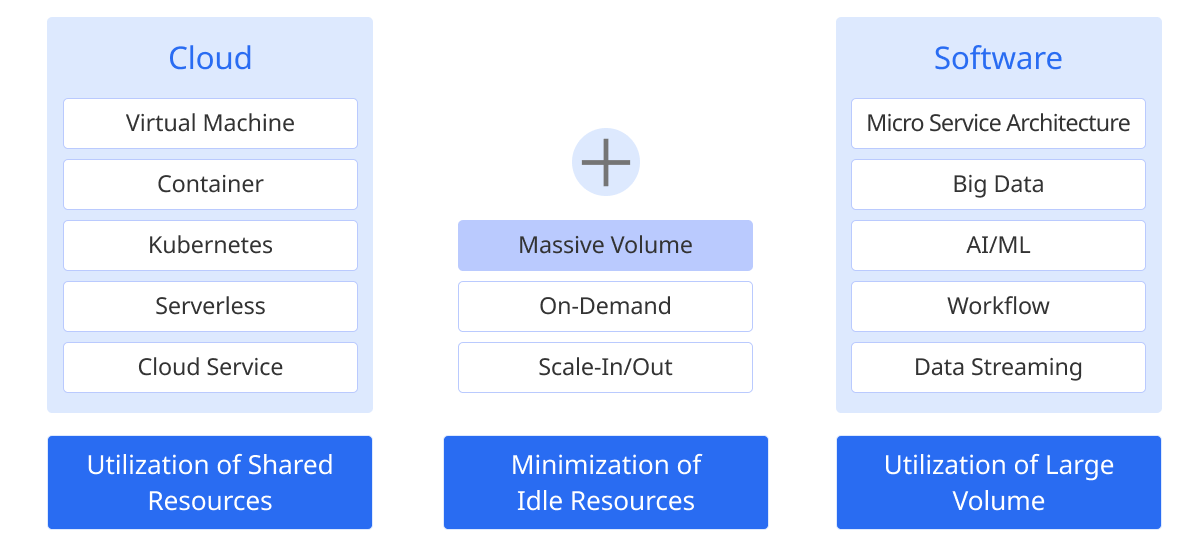
IT technologies are evolving rapidly into cloud computing, containerization, serverless architecture, and so on. These technologies allow efficient use of resources and use of large-scale resources on demand. In particular, the evolution of cloud technology is leading the evolution of other software technologies.
-
Introduction of cloud and container technologies: companies are maximizing the flexibility of the infrastructure through the hybrid cloud, which combines public cloud and private cloud.
-
Use of on-demand resources: you can use resources efficiently on tasks that require large-scale data processing and scale up or down resources when needed.
Proliferation of Microservice Architecture (MSA)
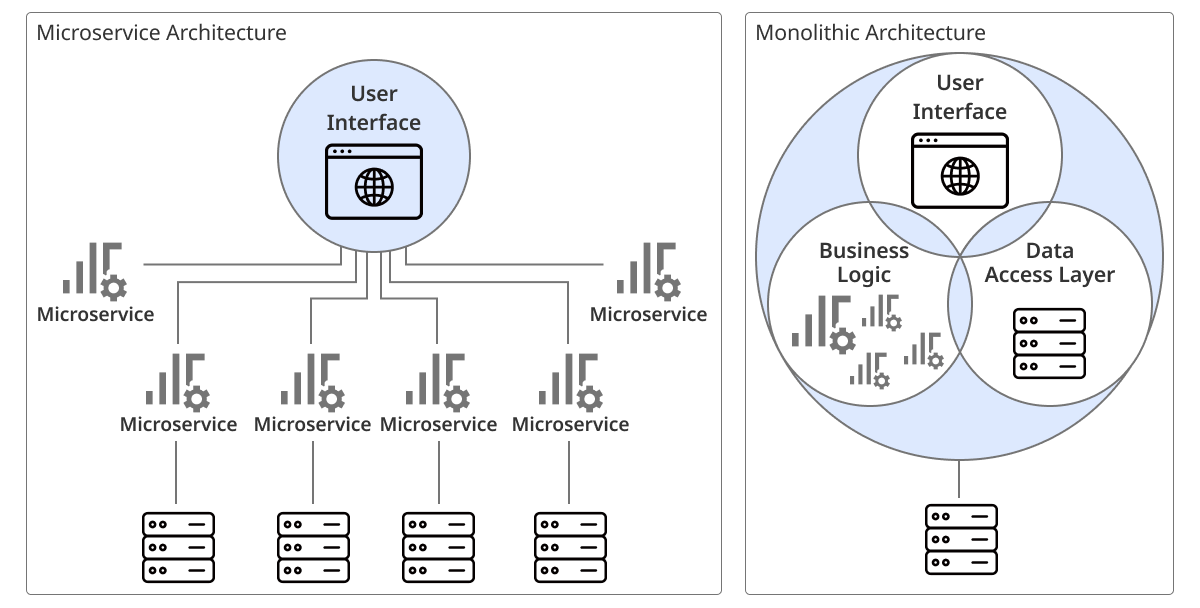
Microservice Architecture (MSA) operates applications by separating them into several individual services, which significantly increases the flexibility and scalability of the IT environment.
-
Lightweight applications: as each service can be developed and deployed independently, there is no need to modify the entire system every time a change is required.
-
Isolation between services: enhances system stability as it is designed not to affect other services when problems occur.
Introduction of container technology
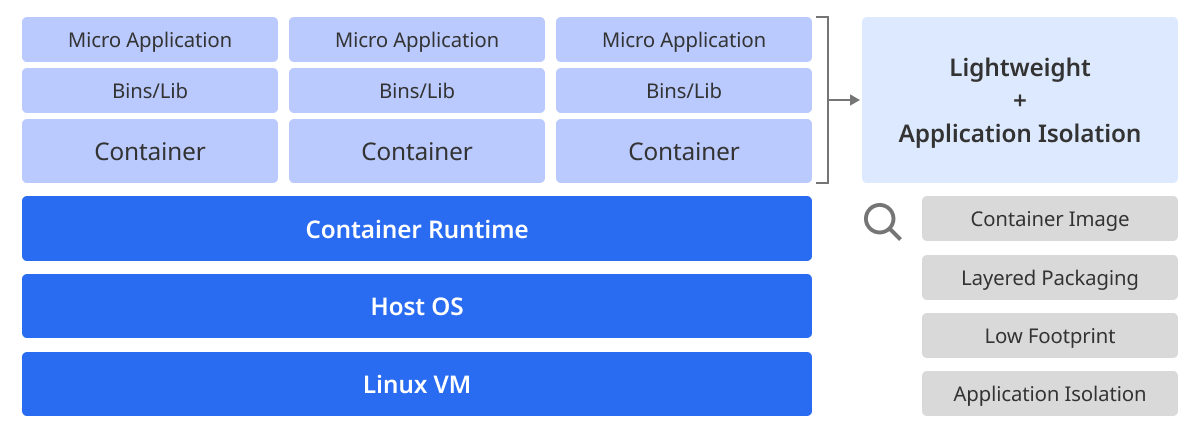
A container packages applications and every element needed for them so that they can run in lightweight units. This contributes to increasing the efficiency of resources and reducing the complexity of deployment and management. It also enables isolation and management of service units with less resources, accelerating the proliferation of microservices.
-
Lightweight Containerization: with containerization, applications can run the same way in various environments.
-
Automated deployment and management: you can automate the deployment and management of containers by using Kubernetes, a tool for container orchestration.
Enhancement of service operability
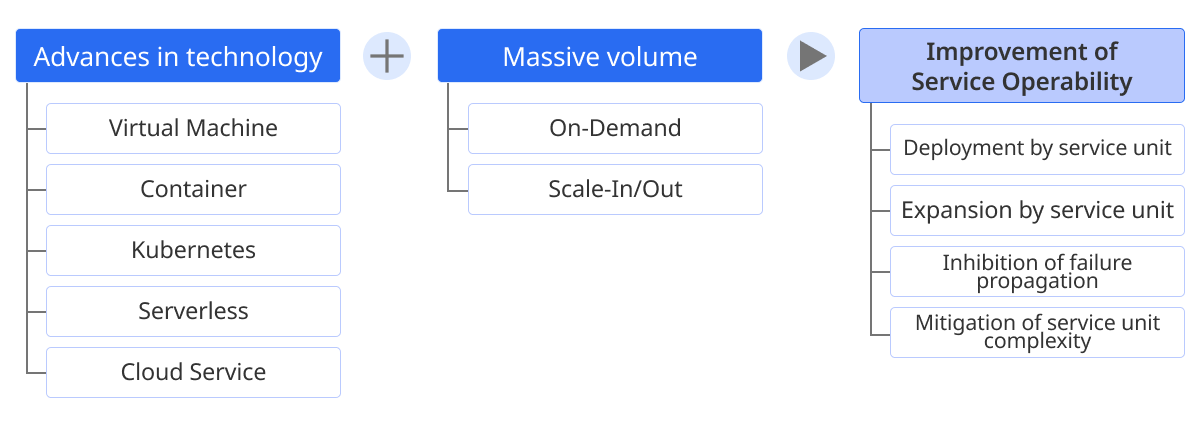
The advancement of IT technology has significantly enhanced the service operability. In particular, the evolution of cloud technology has increased the flexibility and scalability of services, which plays an important role in strengthening the business agility of companies.
-
Dynamic scaling: adjusts the scale of the service automatically as necessary, enabling the efficient use of resources.
-
Expansion of service unit: each service can be expanded individually, which helps prevent the spread of malfunction.
Increased complexity of IT system
As technologies evolve, the complexity of IT systems is increasing as well. In particular, the introduction of cloud and Microservice Architecture has diversified the system components and increased interdependency. In this situation, a problem arises that the existing IT monitoring method is not capable enough to obtain visibility into the entire system.

Source: https://www.worth.nl/en/articles/5-reasons-to-fight-complexity-in-your-it-systems
-
Increased complexity: the combination of various services and technologies has increased service complexity.
-
Necessity for a new observation method: as it is difficult to manage these complex systems using the existing monitoring method, a new observation method is needed.
Changes in monitoring environment
Today's IT environment is changing drastically with the evolution of technologies. These changes also have a big impact on the monitoring environment, and it has become difficult to manage complex and dynamic IT systems effectively using the existing monitoring method.
Changes in observation target
The traditional monitoring method was largely limited to the inside of certain resources, such as servers and databases. However, with the introduction of cloud services and the increase in use of containers and Kubernetes, the scope of monitoring targets has expanded significantly. Now, it is necessary to collect various indicators and data that occur outside of resources, not just the inside. And as the use of cloud has become common, we also have to monitor the platform information that the cloud vendors have.
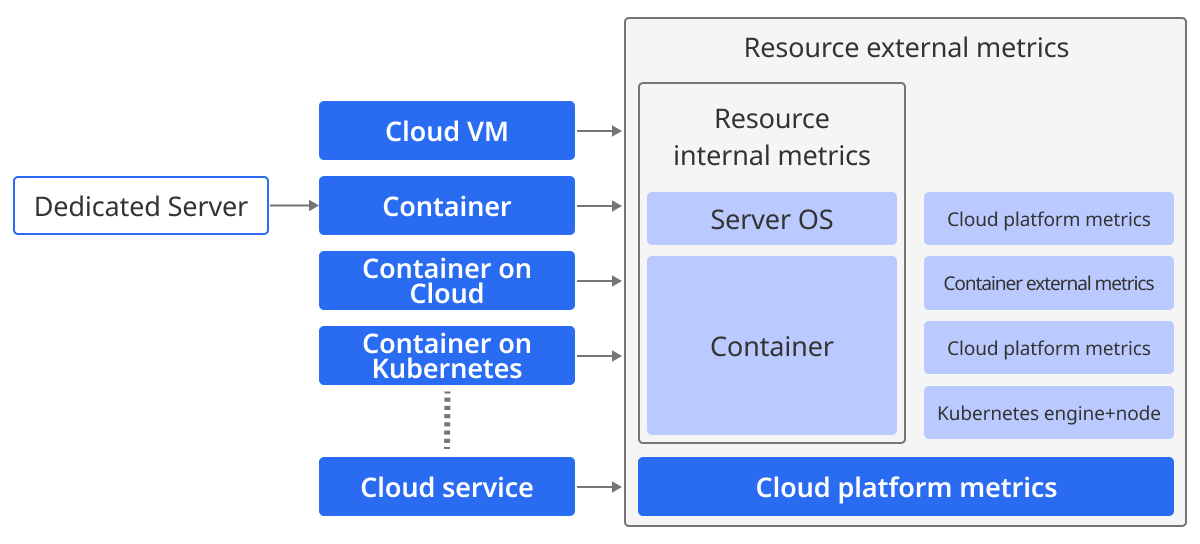
With the transition to MSA environment along with the combination of container environment, the scope of monitoring has expanded to include resources, applications, and service call flows as the targets for observation.
Evolution of monitoring technology
The monitoring technology has been evolving continuously with the increasing complexity of IT systems and the growing amount of data. Particularly, new attempts have been made to collect data that could not be collected with existing monitoring methods, and analysis using artificial intelligence (AI) and machine learning (ML) technologies is increasingly common. Here are some typical use cases.

-
eBPF (Extended Berkeley Packet Filter): a program that runs in the Linux kernel to collect data in the kernel space.
-
Data collection tools, such as Telegraf: collect and transmit metrics from various data sources.
-
Analysis through AI/ML: detects anomalies and conducts predictive analysis based on collected data.
Changes in monitoring users
As the scope of monitoring targets has expanded, so its user base has broadened. Previously, only system engineers (SE) or administrators used monitoring tools. However, recently, in systems where applications are developed and deployed as service units, the segregation of roles has become less distinct compared to the past. The DevOps team and developers are actively participating in checking the status of the system in real time and solving problems by using monitoring tools. Moreover, with the appearance of a new job called Site Reliability Engineering (SRE), the monitoring ability has become an important factor to evaluate an individual’s capacity.
These changes have been made so that all related teams can understand the system status and respond swiftly when problems occur, as the complexity of the IT system has increased.
Changes in monitoring needs
Today’s IT environment is changing rapidly with the acceleration of Digital Transformation (DX). These changes caused changes in monitoring needs, and the factors that were optional in the past have now become mandatory.
Transition from optional to mandatory
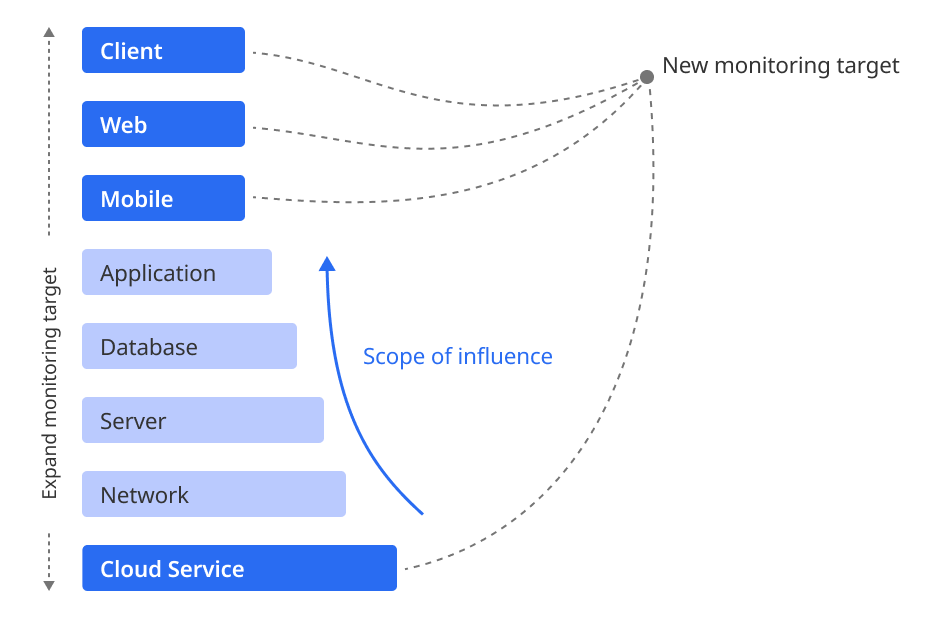
In the past, monitoring certain elements was merely an optional choice. However, now the situation is changing so that all elements must be monitored. This is the result of diversification of system components and increased management points. Monitoring the status of each component is now essential for maintaining business continuity and system stability.
-
Increased management points: monitoring needs have increased as complex elements, such as various cloud services, clients, web, and mobile, were added.
-
Essential monitoring: the need to monitor all IT resources and services has been increasing.
Increase of resources to be monitored
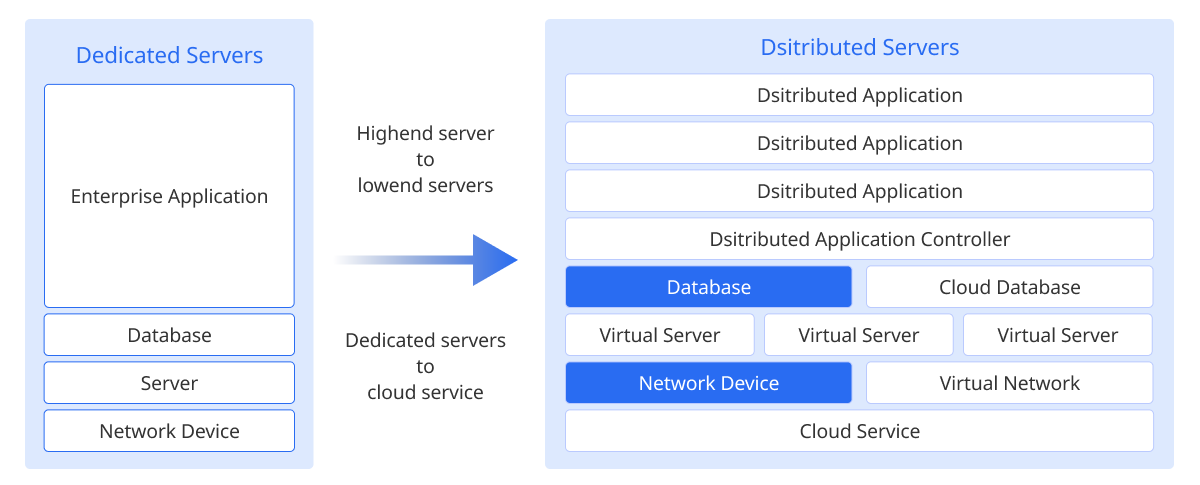
The transition from the Monolithic Architecture to the Microservice Architecture (MSA) has expanded the scope of resource monitoring significantly. Because of this, companies now need to monitor various resources, such as distributed servers, cloud services, and virtual networks beyond single servers or network devices.
-
Expansion of monitoring targets: new resources, such as virtual servers, cloud databases, and distributed applications, need to be included as monitoring targets, not just the existing traditional servers and network devices.
-
Supporting distributed architecture: an ability to monitor the performance of distributed servers and networks effectively and understand the status of the entire system is required.
Importance of Performance Monitoring
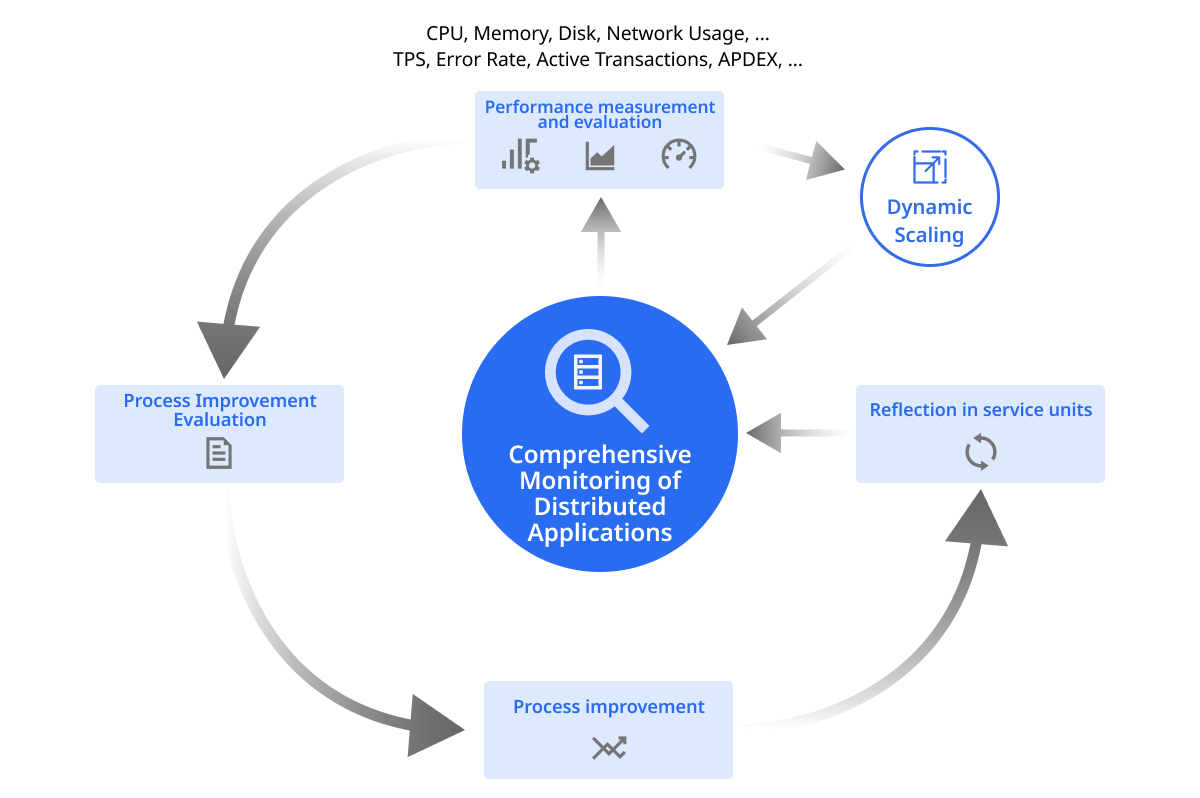
As the scope of monitoring targets expanded with the introduction of Microservice Architecture, it has become important to monitor the performance of resources and applications. This is essential in maintaining the general performance of the system, including monitoring the flow and performance of each service call. Also, in the current distributed architecture environment, dynamic measurement, evaluation, and addition of available resources are performed automatically. For this reason, the performance evaluation of services has become important as a criteria for operation.
As the scope of monitoring targets expanded with the introduction of Microservice Architecture, it has become important to monitor the performance of resources and applications. Monitoring the flow and performance of each service call is essential in maintaining the general performance of the system. Also, in the current distributed architecture environment, dynamic measurement, evaluation, and addition of available resources are performed automatically. For this reason, the performance evaluation of services has become important as a criteria for operation.
-
Application Performance Monitoring: Monitoring application performance in real time allows early detection of and response to system performance deterioration.
-
Service Call Flow Monitoring: Monitoring call flows between services in the distributed environment allows swift understanding of performance issues of the system.
DX-IT operation
Performance Monitoring observes and analyzes various indicators of the system in real time, optimizing the utilization of the infrastructure resources. This plays an important role in maintaining the quality of the system. Especially in a fluid infrastructure environment such as cloud, proper distribution and expansion of resources are directly connected to the business outcome, making Performance Monitoring an essential tool.
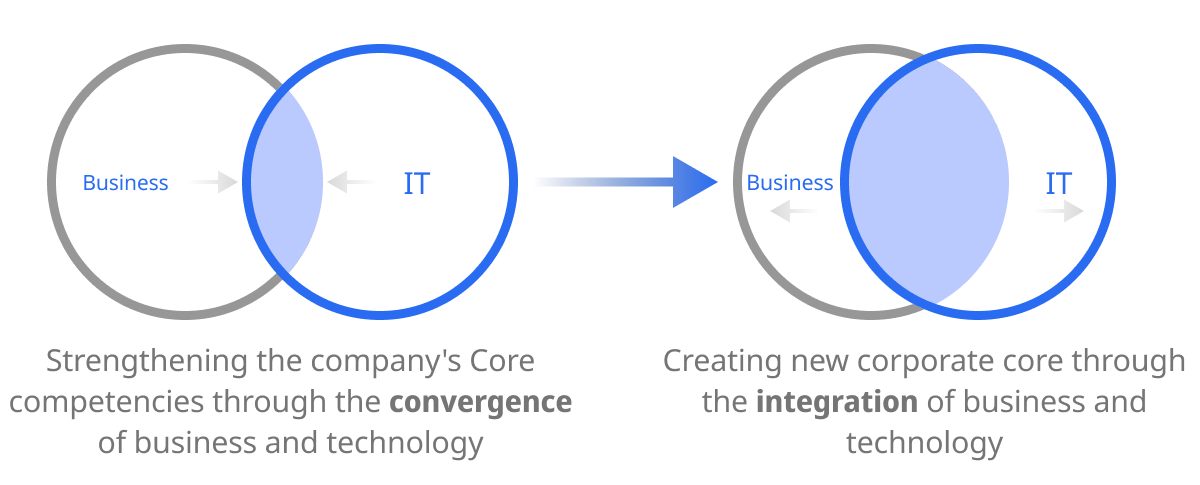
In the past, business and IT technology either operated separately or converged at the minimum interfaces at best. However, with the acceleration of Digital Transformation (DX), IT has become the core of the business strategies beyond the simple supporting role. Now, IT and business should operate in a complete integration. And in this process, Performance Monitoring has become an essential tool.
As an essential element of DX-IT operation, Performance Monitoring is a key tool that supports integration of IT and business. Not only does this monitor the performance of a system, but it also maximizes business outcomes and plays an essential role in strengthening a company's competitiveness. Performance Monitoring will continue to play an essential role in realizing the business-IT integrated operation model as an important part of IT operation.
Integrated Monitoring
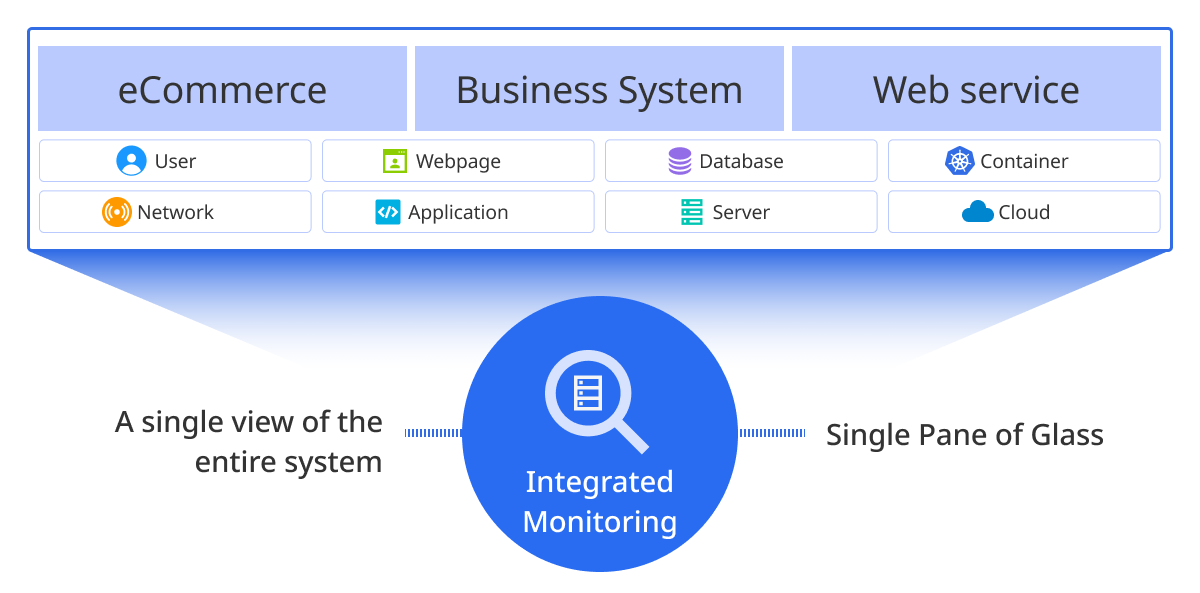
As the complexity of IT systems has increased, it has become difficult to satisfy all monitoring demands with a single tool. Integrated Monitoring provides an ability to monitor and manage various IT assets, such as servers, networks, and applications, on a single platform. This is an essential element that supports DX-IT operation.
-
Securing visibility across the entire system: you can get a full view of all system components through Integrated Monitoring. This enables swift responses to any problems and is essential for maintaining the stability of the system.
-
Efficient resource management: Integrated Monitoring enables you to comprehend the resource usage status accurately and prepare optimization plans if necessary. This enables both the reduction of unnecessary resource waste and an increase in cost efficiency.
-
Providing a single pane of glass: the operator can monitor the status of the entire system easily as Integrated Monitoring provides a single pane of glass to see all data collected across the various systems and applications.
Necessity for visualization
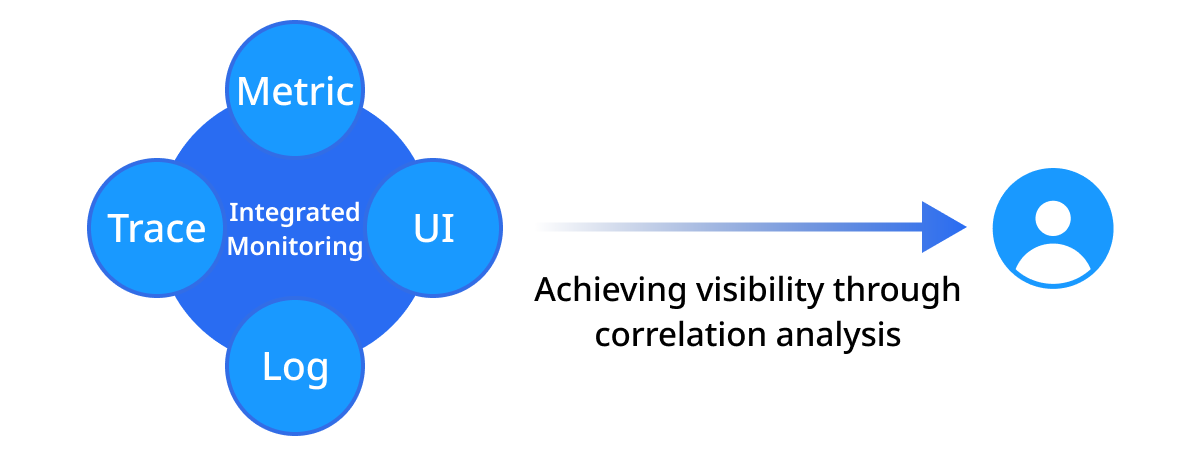
Visualizing the status of a system with monitoring data is essential to increasing operation efficiency. Visualized data provides an important insight to the operator and supports quick decision-making.
-
Data visualization: by visualizing data collected from various sources effectively, it can provide important information to the operator intuitively.
-
Detecting and responding to malfunctions: Visualized data allows you to detect malfunctions swiftly and respond to them effectively.
Prolonged malfunction detection time and recovery time have a negative impact on operations. This is because it becomes more difficult to recover the service swiftly when malfunctions occur as the visibility decreases due to the complexity of cloud and hybrid environments.
Main challenges of IT monitoring
In the current IT environment, monitoring has become an essential element. But several challenges need to be overcome in order for the monitoring system to operate effectively.
IT operation supporting DX
Improvement of IT performance affects business speed and outcomes directly. As the performance of the IT system gets optimized, the growth and development of business accelerates, and it has become a very important element in the current digital transition era. Now IT and business are in an inseparable relationship, and the success of the IT operation directly leads to the business outcomes.
Successful IT operation during the digital transformation process not only maintains the system stably but also plays a crucial role in increasing business speed and strengthening competitiveness. Therefore, enhancing the IT performance is a key element that determines the success of the digital transformation, and it is becoming an essential condition that ultimately guarantees the sustainable growth and performance of a company.
Operation efficiency and cost reduction
The establishment and operation of an IT monitoring system requires considerable costs. In particular, establishing and maintaining different monitoring solutions to work with various environments and tasks needs a lot of resources. Therefore, an integrated monitoring solution is needed to maximize the operation efficiency and reduce costs. This integrated solution can contribute to reducing duplicated investment and maintenance costs and increasing operation efficiency.
Absence of operation manager and response to scaling
As the complexity of IT systems has increased, the role of operation managers who manage them has also become important. However, a lot of companies are having difficulties, such as not being able to find enough workforces and having to take care of operation and development at the same time in the immature DevOps environment. Also, systems need to scale (out) quickly when traffic increases, but in many cases, there is a lack of such an operation system that can support this process effectively.
In short, it is necessary to reduce the operation burden through automatic monitoring and scaling solutions and to establish a system that can respond to business demands quickly.
-
From 2016 to 2021, 42% of companies experienced downtime due to human errors.
-
40% of companies in the world experienced cloud-based data leakage for the last 12 months.
-
If you make customers wait for more than 3 seconds, 50% of the potential customers will leave your website.
Performance monitoring and system quality maintenance
Monitoring system performance and maintaining system quality accordingly is one of the key challenges of IT operation. But it is a very difficult task to effectively collect data from distributed applications and complicated infrastructure and analyze it. Therefore, a methodology is required that can enhance performance monitoring and maintain system quality.
By introducing a high-performance monitoring tool to collect performance data in real time, you can maintain the system quality based on that.
Responsiveness to business changes
The IT environment changes rapidly following business demands. In order to respond to these changes quickly, the monitoring system needs to operate flexibly and promptly. However, the existing fixed monitoring systems have limits in responding to business changes.
Therefore, you need to introduce a flexible monitoring solution and design your system so that it can respond to business changes promptly.
Solutions to challenges
Integrated Monitoring
The modern IT is an environment where complex and various systems are interconnected to operate. In this kind of environment, monitoring is essential to check and manage the state of each system effectively. However, traditional monitoring approaches were confined to specific targets or systems, limiting the ability to gain a comprehensive understanding of the overall IT infrastructure status. Consequently, the need for integrated monitoring is being emphasized more and more to solve these problems.
Monitoring until now
-
Monitoring by targets
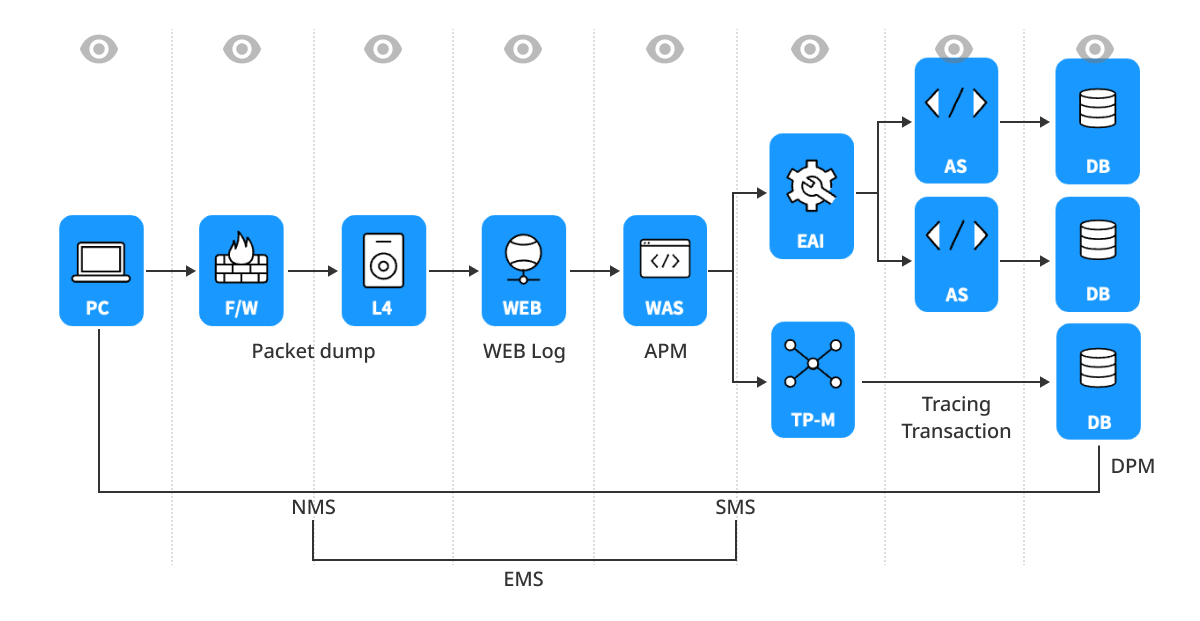
The traditional monitoring method focused on certain resources or systems and monitored them individually. For example, the traditional monitoring method monitored each element individually by using different tools, such as server monitoring, network monitoring, and application monitoring. This approach was useful in checking the state of each system but had limits in understanding the interaction between systems or the overall performance comprehensively.
-
Siloed information: it is difficult to check the overall state of the IT infrastructure comprehensively as the data of each system is isolated.
-
Delayed response to malfunctions: response to malfunctions may be delayed because it is difficult to understand how a problem of a certain system affects other systems.
-
Inefficiency in operation: as monitoring is duplicated in multiple systems, the efficiency in operation decreases, and maintaining data consistency between each system becomes difficult.
-
-
Monitoring by role
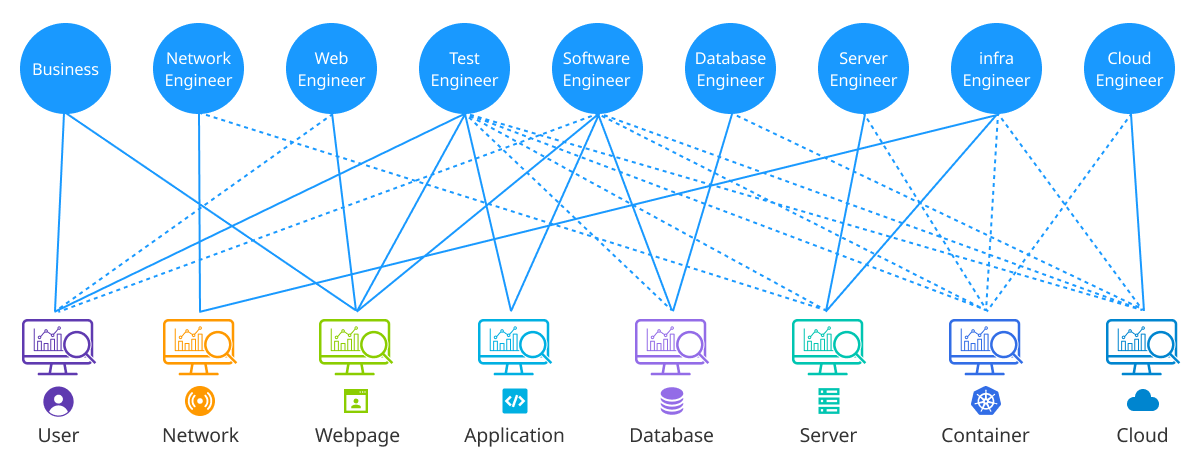
In the case of existing monitoring systems, different managers, such as system engineers, network managers, and application managers, used their own tools to monitor only the areas they managed. This method enabled each team to understand the performance and state of certain areas deeply. But when problems occurred, it was difficult to cooperate between teams, and it took time to analyze the cause of the problems comprehensively.
-
Lack of communication: as the tools and perspectives of each team differ, they need to communicate based on different data when problems occur, which may cause misunderstandings or delays in decision-making.
-
Difficulty in finding the root cause of the problem: when it is not clear in which system the cause of a problem is, each team may try to avoid taking responsibility, causing delays in problem solving.
-
-
Monitoring by system
Monitoring by system is a method to monitor different systems individually. For example, you monitor database systems with a database monitoring tool while monitoring networks with a network monitoring tool. This method can optimize the performance of each system individually but has limits in monitoring the connectivity between systems and the overall performance.

-
Inefficiency in workload management: as each system has a different workload, an integrated monitoring solution is necessary to manage them efficiently.
-
Increase in costs: monitoring each system individually may increase costs from the duplicated use of monitoring tools.
-
Integration in monitoring
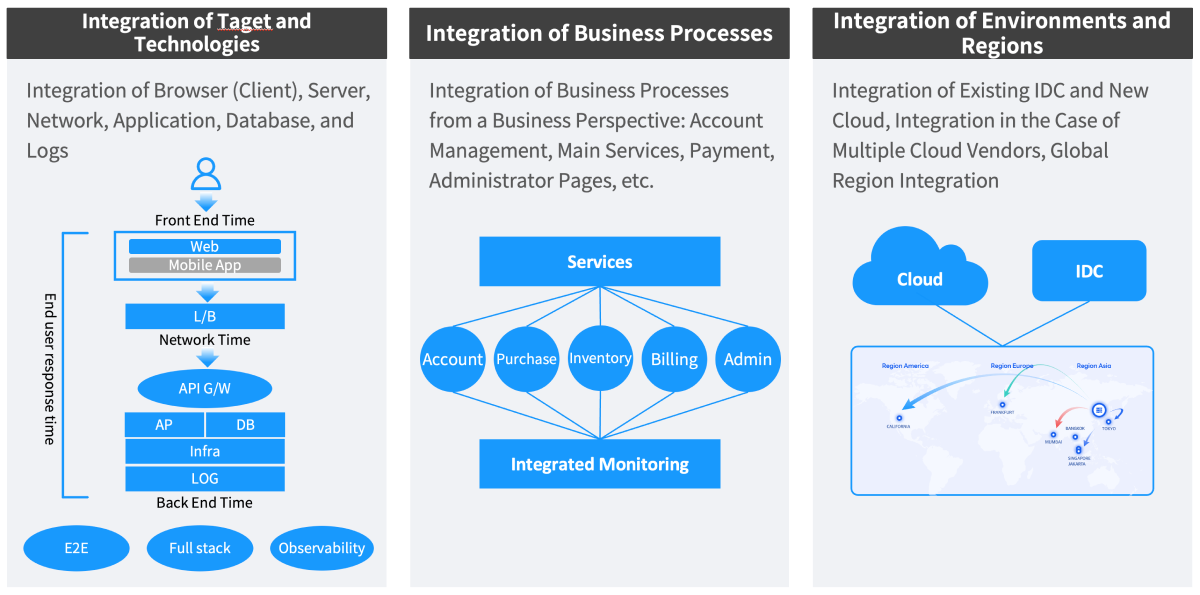
As the monitoring environment changes, the monitoring method limited to individual systems or areas is showing its limitations. In order to solve this issue, we need a new approach that integrates monitoring targets, technologies, tasks, and environment.
-
Integration of targets/technologies
The first step of Integrated Monitoring is to integrate various monitoring targets. We need to be able to integrate and monitor all IT assets, such as servers, networks, applications, and databases, on a single platform. In addition, we need a system that integrates their technologies and provides a full view of the state of all assets at a glance on a single dashboard. With this, you can understand the connectivity between systems and monitor the state of all IT infrastructure in real time.
-
Integration of tasks
Integrated Monitoring promotes task integration in the IT operation team. Integrated Monitoring allows all teams to cooperate based on the same data, moving away from the existing method of monitoring by separate responsibilities. For example, system engineers, network managers, and application managers use the same monitoring platform to cooperate, and they can respond quickly and effectively when problems occur.
-
Integration of environments/regions
Today’s IT environment include various infrastructure, such as hybrid cloud, multi-cloud, and on-premise environment. And in this kind of environment, Integrated Monitoring is essential. With this Integrated Monitoring that covers Public Cloud, Private Cloud, and on-premise environment, you can manage systems in various regions and environments consistently. This is especially important to companies that run global businesses.
Real-Time Observability
In the current IT environment, Observability has become an essential element to maintain the availability and performance of the system and to respond to business demands quickly. Simple monitoring is insufficient for a complex and distributed system structure; we need the ability to check the system's state in real time and solve problems promptly.
Main components of observability
Monitoring is simply a process to observe and record the activities of a system. A monitoring tool collects data on how an application works. Through monitoring, you can check the application's state and maintain alertness to known points of malfunction.
Observability, the parent concept of monitoring, includes all these functions and more. It is because when we have to solve problems of complicated cloud native distributed systems, we need more and various tools. We cannot predict or figure out in advance what kind of malfunctions may occur. Observability helps find and solve so called “unknown problems” in a new cloud native world.
Monitoring is used to monitor and improve the performance of applications. On the other hand, Observability is more of affecting business-centered outcomes or goals by measuring the inside of a cloud native system. For example, what are the effects to users? How does it affect customers? How can we iterate more quickly? And how can we provide more benefits to the entire business more quickly? Observability is an approach with a bigger picture to continuously operate systems.
The main components of Observability are as follows:
-
Metrics
Metrics are an indicator that quantitatively shows the performance and state of a system. The key metrics include CPU utilization, memory usage, network bandwidth, transaction processing speed. In order to realize Real-Time Observability, it is important to collect and analyze these metrics in seconds.
-
Log
Log is the data that records information on events or errors occurring in a system. You can track a series of events that occurred in a system and find out the cause of certain problems through logs. In the Real-Time Observability environment, we have to be able to find the occurrence time and cause of problems quickly by collecting and analyzing the log data in real time.
-
Trace / Span
Trace is used to track the flow of work conducted in an application. This is especially important in a distributed system and useful in finding the cause of bottleneck phenomenon or performance deterioration by analyzing the call relationship between each service as well as their processing time. You can visualize the complicated process flow of monitoring targets and solve problems quickly through Trace.
-
Profiler
Profileris used to analyze the performance of an application in detail and optimize it. It is useful in finding where the performance bottleneck phenomenon occurs in an application by measuring the runtime of certain codes or functions and monitoring resource consumption. In the Real-Time Observability environment, Profiler analyzes the performance of the monitoring target in depth and supports the system to operate in the optimal state. With Profiler, you can prevent performance deterioration in advance and maintain the optimized performance.
Necessity for the distributed system and Real-Time Observability
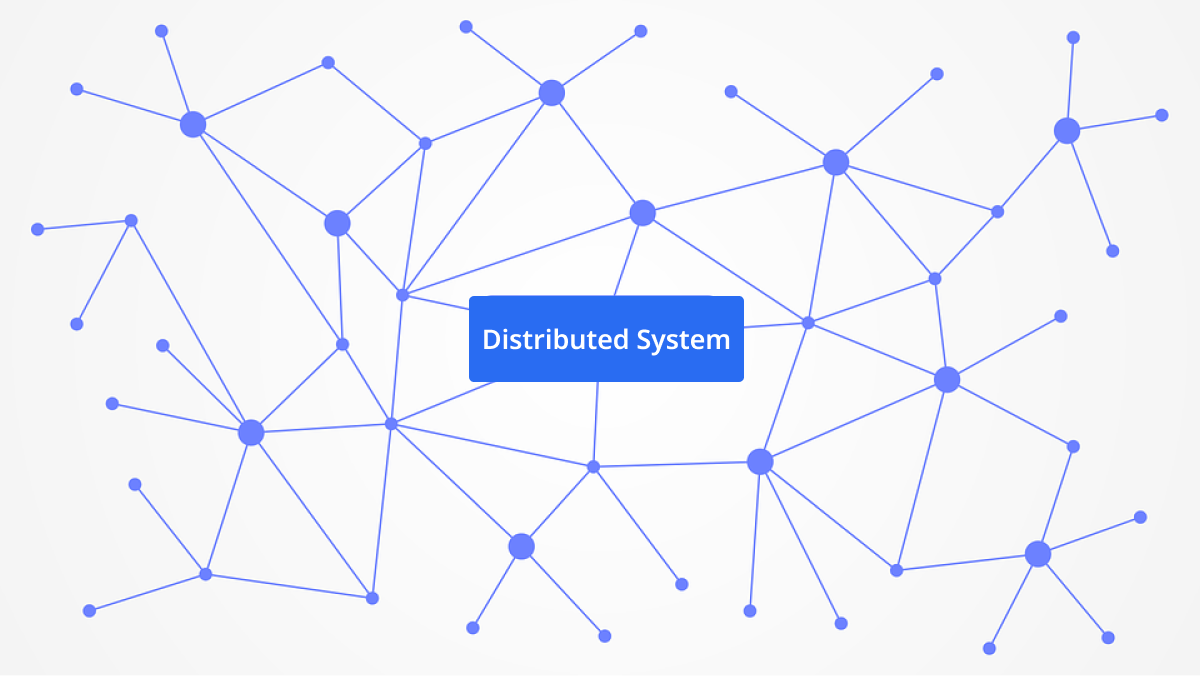
Today’s IT system is becoming more complicated with the introduction of Microservice Architecture and cloud environments. In such a distributed system, it is very important that various services and applications interact and their states are checked in real time. Real-Time Observability provides the ability to manage such complicated systems and find the problems immediately to respond promptly.
-
Increased complexity: With the introduction of distributed systems and Microservice Architecture, interactions between systems have become more complicated. To manage this, we need Real-Time Observability that can collect and analyze data in real time.
-
Dynamic changes: To respond quickly to dynamic changes of services in a cloud environment, the ability to check the state of the system in real time and take automatic measures based on that is important.
Main challenges of realizing Real-Time Observability
Real-Time Observability means Observability in IT services that require immediacy. Before the user notices the problem, it is important to be able to monitor the state of the system in seconds and visualize a complicated situation. And when a malfunction occurs, we should to be able to identify the point of occurrence and type of the problem quickly. Lastly, for prompt cause analysis, we should to be able to search the cause of the problem with high-resolution data that has been recorded at all times without reproducing the malfunction or additional information collection.
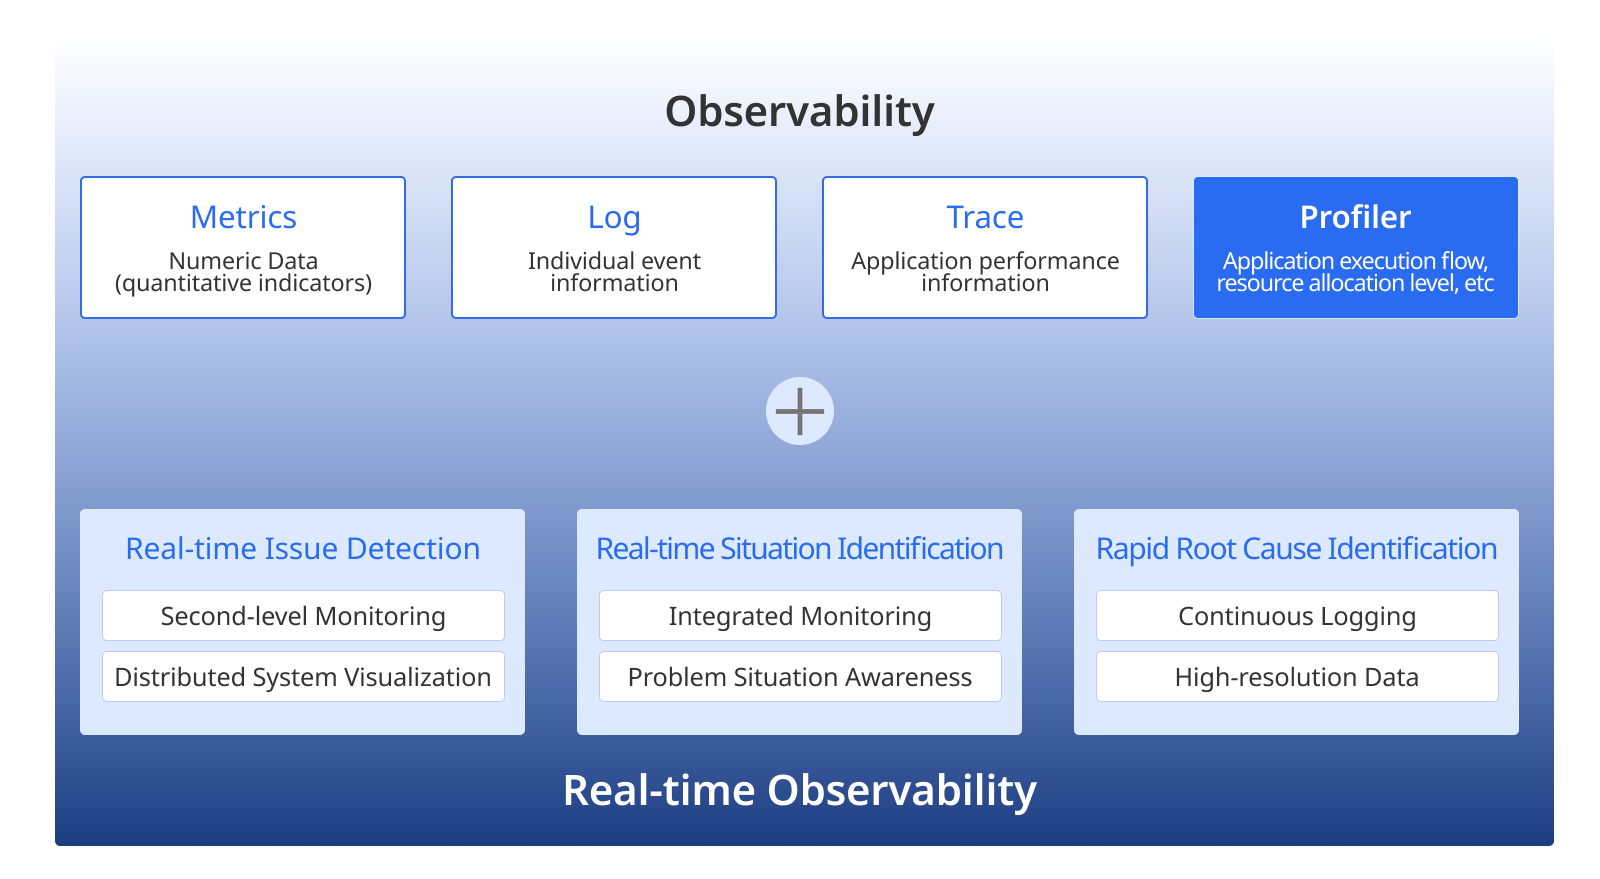
In order to realize Real-Time Observability successfully, there are some main challenges to tackle.
-
Integrated data collection
For effective Observability, it is important to manage data collected from the entire system by integrating it. Data, such as performance indicator (metrics), event record (log), and work flow record (trace), should be collected from various sources in real time and managed on a single platform. From this process, you can see the overall state of the system at a glance and analyze the cause when a problem occurs.
-
Automatic warning and notification system
Real-Time Observability should include the function of making warnings when certain conditions occur and notifying this to the operation team. This kind of automatic warning system enables swift response when a problem occurs and plays an important role in maintaining the availability of the system.
-
Providing integrated visibility
In the current IT environment, a lot of data comes in from various sources, and in many cases, multiple tools are used to manage it. But we need a system that can integrate and show all data in one place without transitioning between such tools. Integrated visibility enables users to easily monitor the data coming from various systems and applications on a single screen.
With this, operators can check the state of the system more clearly and take necessary measures promptly. By providing an integrated view showing all data at a glance, it can increase understanding of the entire system and maximize operation efficiency.
-
High-resolution data analysis
High-resolution data collected in seconds should be analyzed in real time to detect even the finest changes in the system immediately. Through this, potential problems can be found in advance and service interruptions can be prevented.
-
Accepting interoperability
Data can be provided from various sources in various forms. Therefore, data created from open source tools, common tools, cloud environments, and so on should be managed and analyzed on a single platform in an integrated way. That way, consistent visibility on the entire system can be secured, and data can be analyzed consistently.
-
Providing abundant context
Data itself is important; however, it is very important to understand the situational information (context) that surrounds it as well. When a problem occurs, identifying the system configuration, server state, and whether there was any notable workload at the time of occurrence can contribute to solving the problem significantly. This contextual information can enrich the data further, and based on this, unnecessary information is deleted to identify the actual problem.
-
Custom search and analysis tool
The search and analysis tool customized to the business demand of each organization maximizes the value of observability. IT operations teams should set Key Performance Indicator (KPI) and be able to monitor system performance based on that indicator. Also, they need a tool to integrate automated workflow and external data in real time to analyze the data and take appropriate measures.
This kind of tool supports data analysis and automated workflow and helps IT operation teams make decisions quickly and take measures.
Advantages of Real-Time Observability
The advantages of introducing Real-Time Observability are as follows:
-
Prompt troubleshooting: you can detect any problems occurring in real time and find out the cause promptly to take measures immediately.
-
Maintaining service availability: you can check the state of the system in real time to prevent service interruptions and maintain business continuity.
-
Improving operation efficiency: you can improve operation efficiency and reduce workforce resource by automating system operation.
If it takes a long time to specify a malfunction and find its cause, it may be a big obstacle for IT that needs to realize and operate quickly to accelerate business speed. Real-Time Observability plays an important role in solving this kind of problem.
DX-IT operation
Today’s IT operation environment changes rapidly to satisfy the demand of Digital Transformation (DX).
Necessity of DX-IT operation
Digital transformation is now essential, not optional anymore. Companies use technologies to increase operation efficiency, to accelerate innovations, and to take the upper hand in the market. DX-IT operation plays an essential role in supporting this digital transformation.
-
Convergence of business and IT: the concord of business speed and IT performance has become important, and it is essential to expand and optimize the IT system in accordance with business demands quickly.
-
Agility of IT operation: in this rapidly changing business environment, an operation model that supports the IT system to respond quickly is required.
ITIL4-based IT operation model
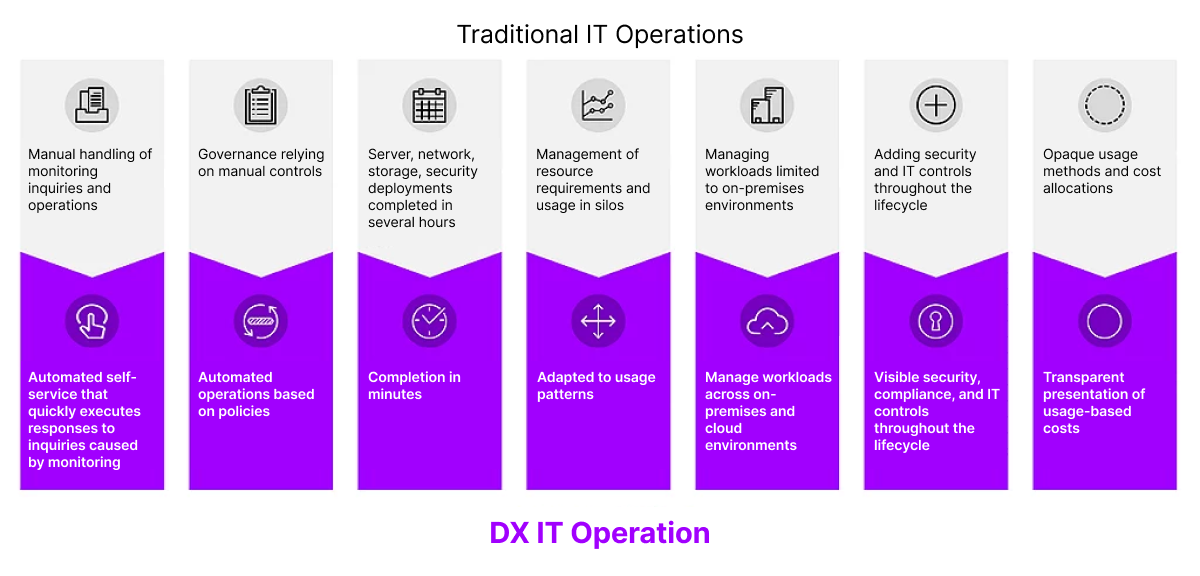
In order to respond to the speed of business and applications’ changes, the evolution to automation and self-service is required, going beyond passive and manual response. The latest ITIL4 operation model is essential to realize DX-IT operation effectively. As the standard framework for IT operation, ITIL4 maximizes the efficiency of service management and reinforces the connectivity between business and IT.
-
Process-centered approach: ITIL4 manages all stages of service provision systematically and secures operation stability through troubleshooting, change management, service quality management, and so on.
-
Automation and standardization: the ITIL4-based operation model can maximize operation efficiency through automation of repetitive tasks and standardization of processes.
Realization of DX-IT operation in the perspective of monitoring
-
Difference between the existing IT operation and DX-IT operation
In the existing IT operation method, troubleshooting by a senior engineer was the common response method when a malfunction occurred. The threshold setting for the system resource was configured in anticipation of the maximum load, and on-premise and cloud were managed with different workloads. This kind of operation method relied on tacit knowledge and was a way of fostering the workforce through on-the-job training (OJT).
On the other hand, DX-IT operation allows automated error log analysis and specification to establish measures quickly. It can automatically analyze the bottleneck phenomenon according to the response time of the system and manage on-premise and cloud environments with consistent workloads. Also, it can increase observability, improve operation level, and equalize skills by using the same tool from operation to development and sharing information in real time.
-
Integrated workload management
Instead of the traditional siloed monitoring tool, a system that can integrate and manage on-premise and cloud environments is introduced in DX-IT operation. And this allows monitoring various environments and workloads consistently, increasing operation efficiency and creating a potential cost reduction effect.
-
Real-time information sharing and operation level improvement
In DX-IT operation, development and operation can share information in real time using the same tools. This enables quick response to malfunctions and reinforces cooperation between teams. In addition, through observability of operation, it can improve operation level and maintain overall skills equalized.
Solutions to challenges in IT monitoring
For the successful realization of DX-IT operation, the main challenges in IT monitoring need to be resolved. These challenges are mainly related to increased complexity and decreased operation efficiency of systems, and we need a strategic approach to tackle them.
-
Integrated Monitoring and Real-Time Observability: Integrated Monitoring and Real-Time Observability that cover the entire system should be introduced to check the state of the system comprehensively and to detect problems in real time.
-
Cost reduction and operation efficiency: we need to reduce the operation costs and maximize efficiency by reducing duplicated use of monitoring tools and having an automated system.
WhaTap Monitoring
In today’s IT operation, DX-IT operation is an essential strategy to respond to the rapidly changing business environment. Let’s take a look at how DX-IT operation can be realized centered around the realization of Integrated Monitoring and Real-Time Observability through WhaTap.
Integrated Monitoring Platform
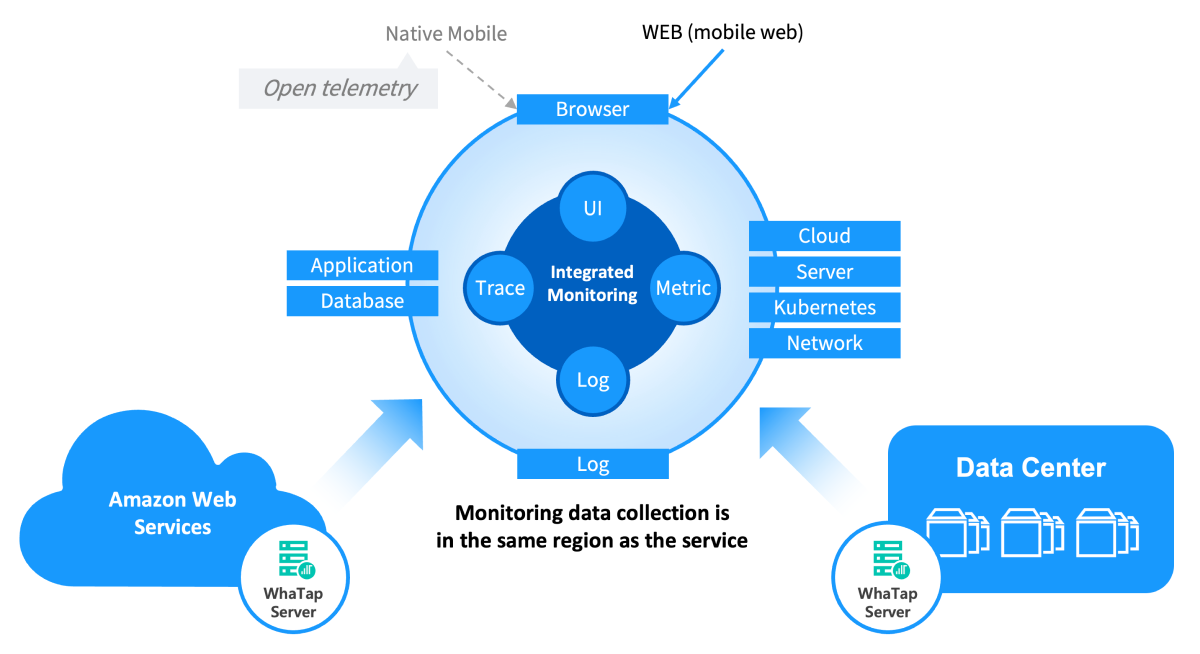
WhaTap is an integrated monitoring and observability platform that supports both SaaS and on-premise types, designed to unify IT systems operated in various environments for integrated monitoring. With WhaTap, you can integrate and manage various infrastructure environments, such as hybrid cloud, multi-cloud, and on-premise environments.
-
Integrated management of various environments: it provides an integrated monitoring function that covers cloud, on-premise, and hybrid environments so that you can manage all IT assets on a single platform.
-
Various data collection: it checks the overall state of the system by collecting metrics, logs, and trace data in real time and analyzing them comprehensively.
-
End-to-end full stack Integrated Monitoring: from the front-end browsers that IT service users experience first to the back-end database, it provides end-to-end full stack Integrated Monitoring using metrics, trace, and logs.
Integrated management of environments and regions
WhaTap integrates and manages various systems that exist throughout cloud and on-premise environments. In particular, it integrates environments or regions where systems exist, enabling unified management, which allows efficient operation even in the global business environment.
-
Integration of environments and regions: through Integrated Monitoring that covers cloud and on-premise environments, you can manage various workloads altogether.
-
Unified data collection and storage: the monitoring data collected from each environment is collected and stored in the respective environment where the service exists, increasing the consistency and reliability of the data.
Real-time problem detection and response
WhaTap provides the ability to monitor the state of the system through real-time data collection by seconds and to recognize any problem immediately. While a typical monitoring system detects problems in a 60- to 300-second interval, WhaTap monitors the system every 5 seconds so that it can detect problematic situations in real time and start the investigation of the cause immediately. Additionally, it detects problems occurring in the transaction in action immediately and supports quick troubleshooting.
-
Monitoring by seconds: it monitors the system in a 5-second interval to detect problems in real time, enabling quick response.
-
Recognizing malfunctions: it detects problems occurring in the transaction in action immediately so that it can start the investigation of the cause in real time.
-
Prompt troubleshooting: by using data collected at all times, it starts the investigation of the cause as soon as any problem occurs and solves the problem without profiling.
Linkage tracking
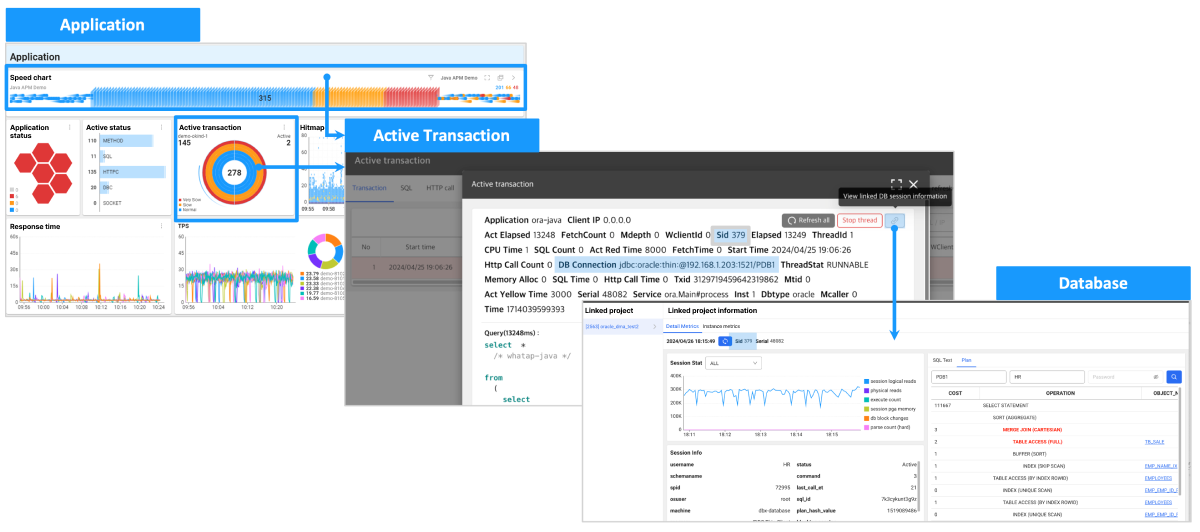
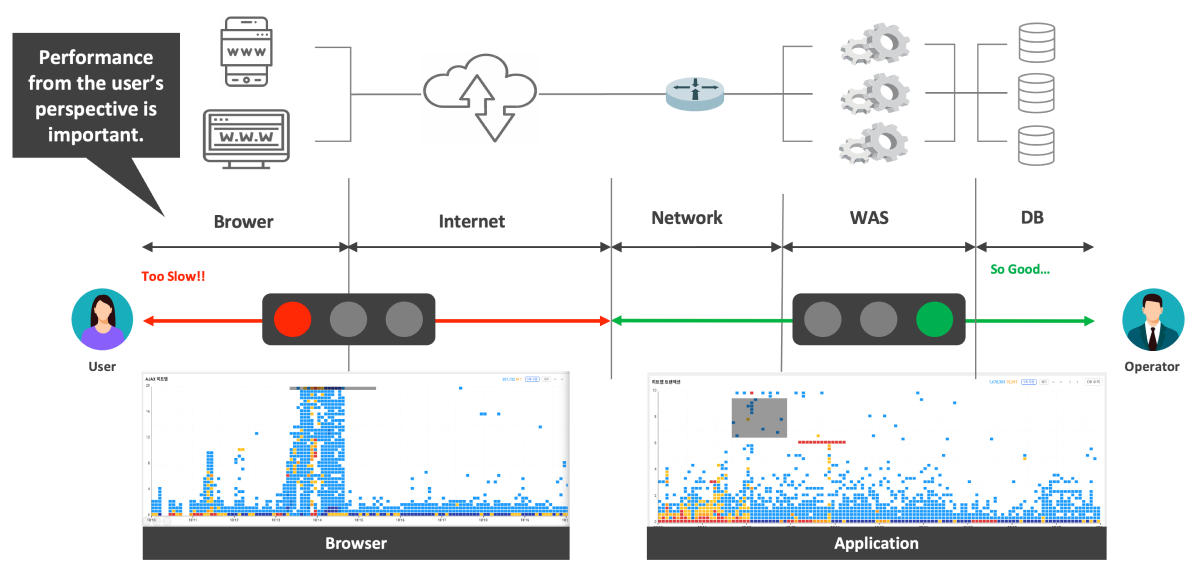
WhaTap provides a powerful linkage tracking function that can track the interactions between various components in the IT system in real time. Through this function, you can track interactions between databases, browsers, and applications and find the cause of any problem quickly.
-
Application-Database linkage tracking: as it tracks the linked transactions between the applications and database in real time, when a problem occurs, it can identify where it occurred. It provides the ability to solve problems quickly, even in a complicated distributed system.
-
Browser-Application linkage tracking: it can track any performance problem that occurred in a browser by linking with an application. With this function, it can identify the problems that the users are experiencing quickly and diagnose the cause of the problems accurately, solving the overall performance problems in real time.
Main functions of Integrated Monitoring
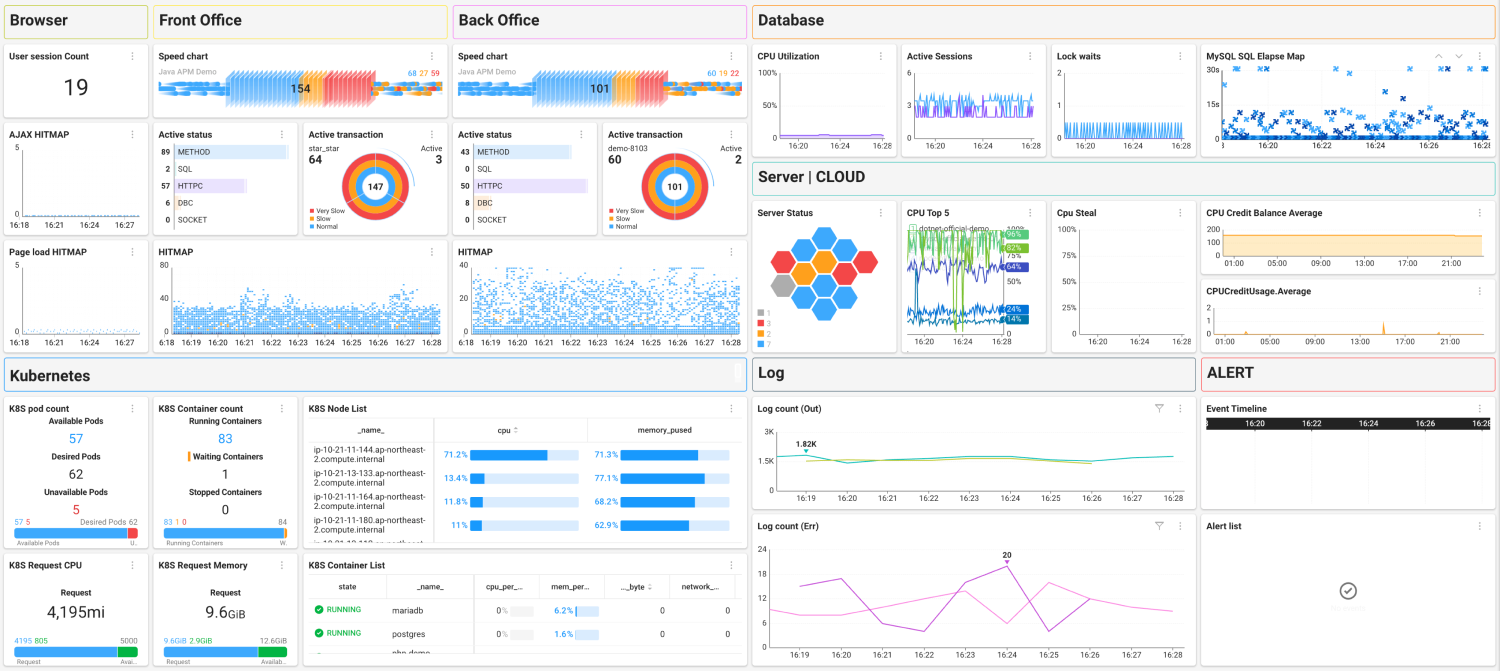
WhaTap allows users to integrate and manage various elements of the IT system, such as browsers, servers, networks, applications, and databases, on a single screen. This function supports users in checking the state of the system at a glance and taking necessary measures quickly.
-
Integrated Monitoring dashboard: it maximizes operation efficiency by integrating and managing all system data on a single screen.
-
Automatic warnings and notifications: when a problem occurs, it provides warnings in real time and helps solving the problem quickly through the automatic notification system.
Realization of DX-IT operation
WhaTap is becoming a key solution to realize DX-IT operation. With Integrated Monitoring and Real-Time Observability, WhaTap provides the ability to check the state of the IT system in real time and the function to troubleshoot quickly.
Real-time monitoring and troubleshooting can increase system availability and maintain business continuity. You can maximize operation efficiency and reduce costs through automatic monitoring and troubleshooting functions.