Exploring the Resource Board
This document introduces the analysis of chart-type widgets in Resource Board of Server Monitoring, one of the WhaTap monitoring services. Let's look at how to identify and analyze the server issues through Resource Board. For more information about the functions of Resource Board, see the following.
The core of the server monitoring is the process. You have to quickly grasp the server status through monitoring and respond to various failure situations so that the process can operate without interruption within the normal operation range. Inferring the resource usage by inquiry is the start. WhaTap Resource Board provides a time-series chart widget that consists of the metrics for CPU, memory, disk, and network so that you can check the resource usage at a glance on the data-intensive screen.
-
Server Status Summary: Server, OS, Total Cores, Avg CPU, Avg Memory, Avg Disk, Server Status Map
-
System operation statistics: CPU Resource Map
-
Early warning and alert: CPU TOP5, Memory TOP5, Disk I/O TOP5, Process CPU TOP5, Process TOP5, Alert Status
Server Monitoring Core Metrics
-
CPU: The CPU performance metric is used as the most important measure to determine the server performance. When the CPU utilization exceeds a specific level, the service starts to be affected. If a problem occurs, you can take actions to reach the target for CPU usage management, including purchasing additional hardware or tuning the performance of the CPU-consuming applications.
NoteIT solutions often have the pricing scheme based on the server performance. It is the same reason that most CPU usages are priced per core.
-
Memory: Check the memory usage including buffers and cache memory. If the memory usage is running out too quickly or continues to drop, you can take actions to reach the management target for memory usage.
-
Disk I/O: Disk I/O is the factor that must be checked when using the network drives. Monitor the disk's read rate, write rate, queue, and latency rate.
-
Network: Network metrics monitor the following: I/O traffic rates and error packets on network interfaces.
Server Status Summary
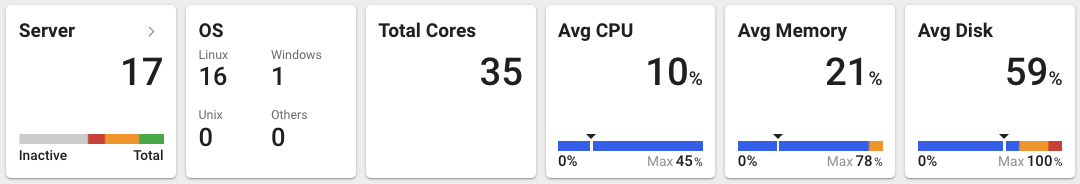
You can easily check the summary metrics for all servers registered in the project through Info Panel at the top of the Resource Board.
You can see the total number of servers and the number of failed servers in the Server widget. If you select ![]() , the Server List menu appears. You can distinguish the servers with icons and colors in the Status column for action required items:
, the Server List menu appears. You can distinguish the servers with icons and colors in the Status column for action required items: ![]() Critical (Red), and possible problem notification item:
Critical (Red), and possible problem notification item: ![]() Warning (Orange), and
Warning (Orange), and ![]() Normal (Green), and
Normal (Green), and ![]() Disabled (Gray). For more information about the Server List, see the following.
Disabled (Gray). For more information about the Server List, see the following.
The OS widget indicates the number of operating systems in the project, Total Cores indicates the sum of the cores of all servers, Avg CPU indicates the average CPU usage of all servers, _ Avg Memory_ indicates the average memory usage of all servers, and Avg Disk indicates the average usage of all server disks.
In addition, if you select the ![]() icon in the Resource Board main chart to go to Server Status Map, you can see the status of servers in the project at a glance through the honeycomb chart. The honeycomb chart view is useful when the number of servers is so great. An individual hexagon indicates a server agent. Servers with problems are visualized in color so you can intuitively identify them. If you select an individual hexagon, the Server Detail page appears for the server agent.
icon in the Resource Board main chart to go to Server Status Map, you can see the status of servers in the project at a glance through the honeycomb chart. The honeycomb chart view is useful when the number of servers is so great. An individual hexagon indicates a server agent. Servers with problems are visualized in color so you can intuitively identify them. If you select an individual hexagon, the Server Detail page appears for the server agent.

You can easily check the outline of the total resource usage and server status by using each widget on the WhaTap Resource Board.
System operating statistics
The most important factor to check the normal process operation is the CPU usage. This is because CPU metric reflects the system load the fastest. WhaTap provides the CPU usage with a distribution chart so that you can check the overall system operation status at a glance. If you select the ![]() icon in Resource Board, you can see the CPU Resource Map widget. You can check the CPU usage distribution for all servers in the project through the CPU Resource Map widget. Drag the cell area to see the detailed information of the section.
icon in Resource Board, you can see the CPU Resource Map widget. You can check the CPU usage distribution for all servers in the project through the CPU Resource Map widget. Drag the cell area to see the detailed information of the section.
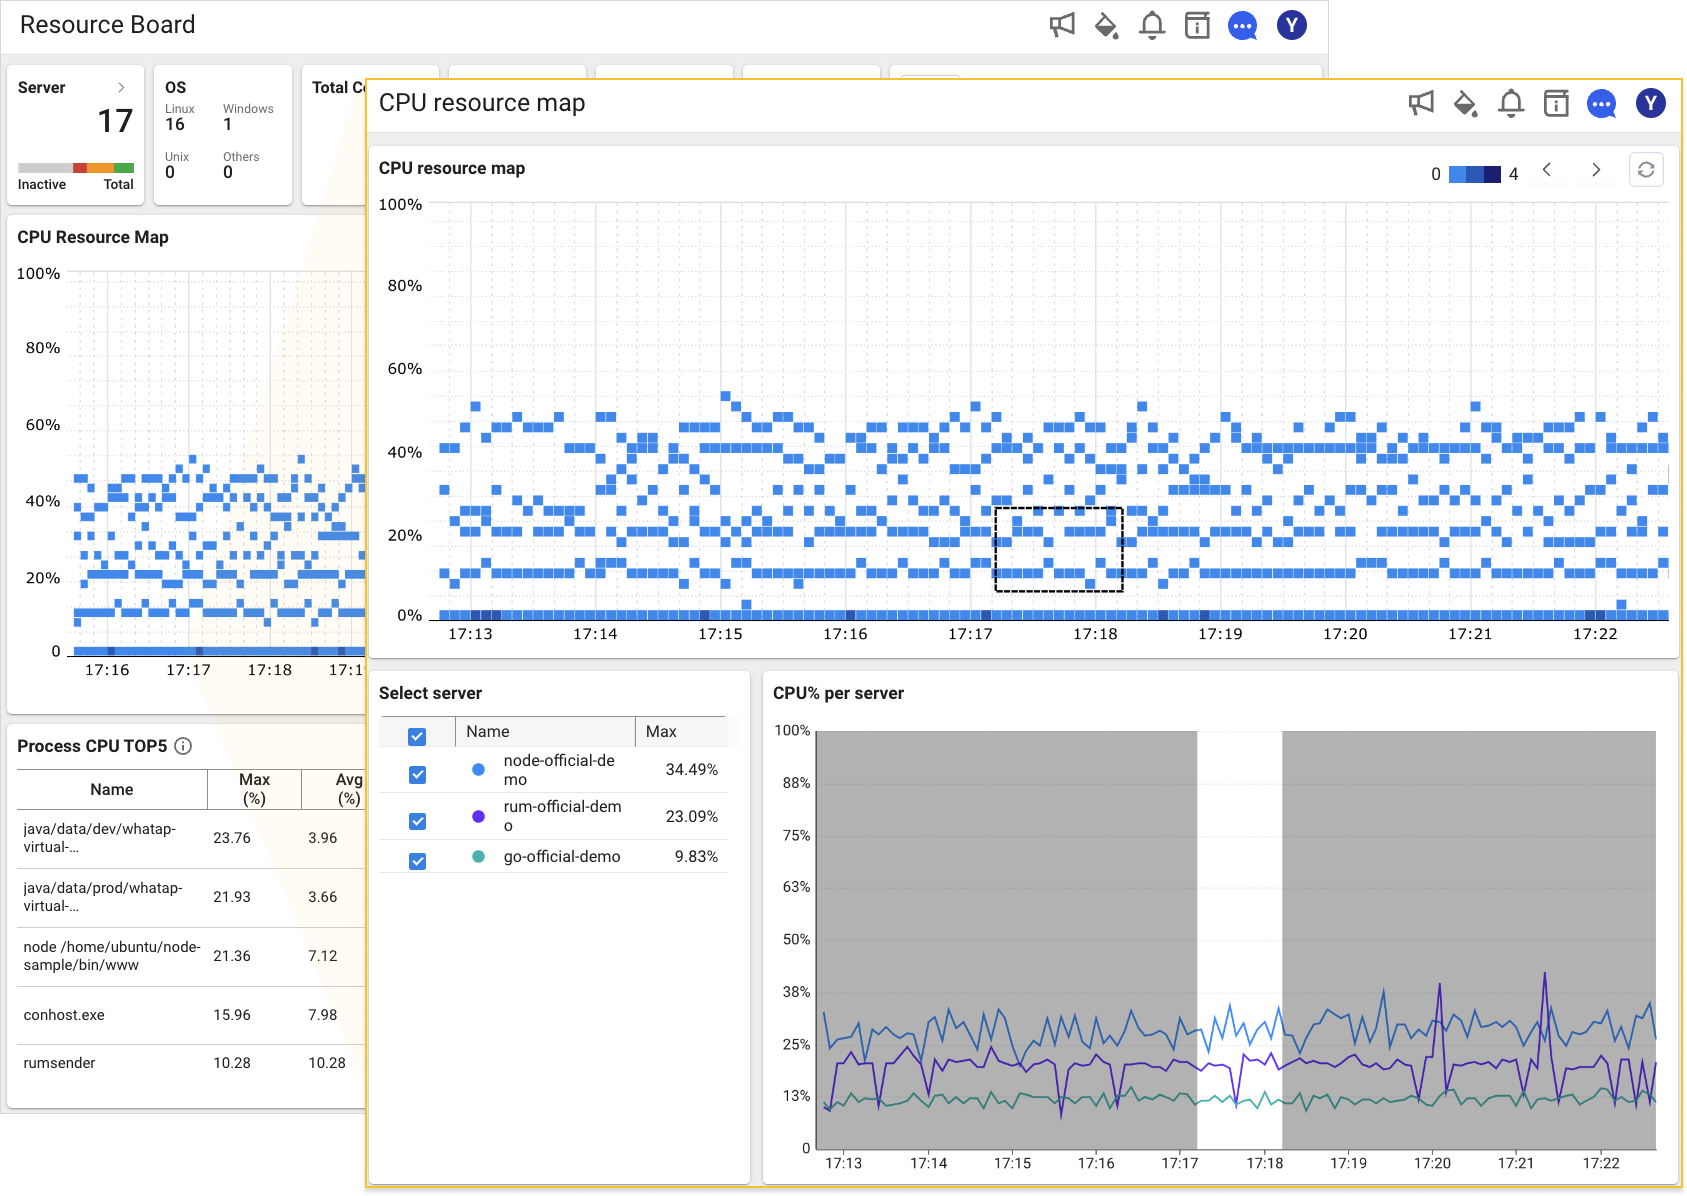
For efficient operation of cloud IT assets, you have to avoid both over and under resources and properly adjust the usage. The following example screen seeks to balance the cost and performance efficiency with the resource usage around 50% for operation optimization. In case of the example, you can avoid any temporary failure with the performance margin of 50% when the usage spikes.
Over-input is the condition in which systems have been overinstalled in the service and the infrastructure costs too much. Because system stability is guaranteed, users are not affected significantly during the spike. To reduce the time for monitoring, there is a tendency of over-input causing to decrease the average usage. However, because the increase of the tendency of overinput causes the cost to increase, it is important to quickly recognize the condition. Under-input is the condition in which the system usage is out of the management range due to the increase in load by a system change, and causes deterioration in service quality and convenience. Appropriate action must be taken before users leave the service.
WhaTap CPU Resource Map makes it easy to identify and check over- and under-input situations. The lower part of the map tends to be over-input, and the upper part tends to be under-input.
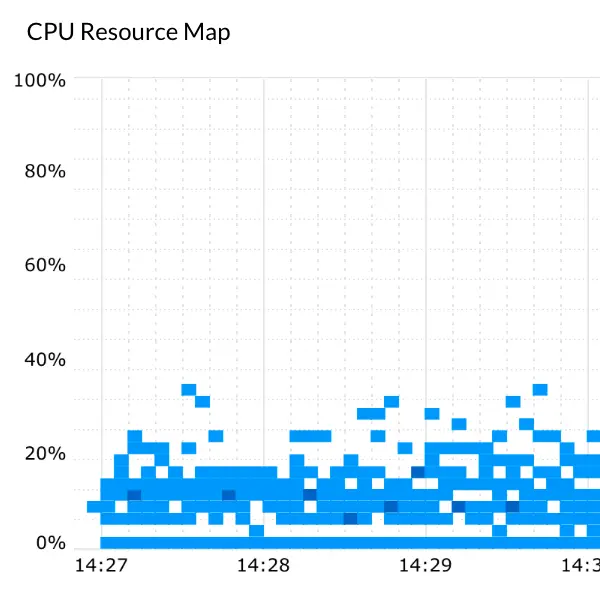
Drag the ![]() area at the bottom of the example screen CPU Resource Map to view the detailed information. In the CPU% per server graph, you can see the over-input tendency as follows:
area at the bottom of the example screen CPU Resource Map to view the detailed information. In the CPU% per server graph, you can see the over-input tendency as follows:
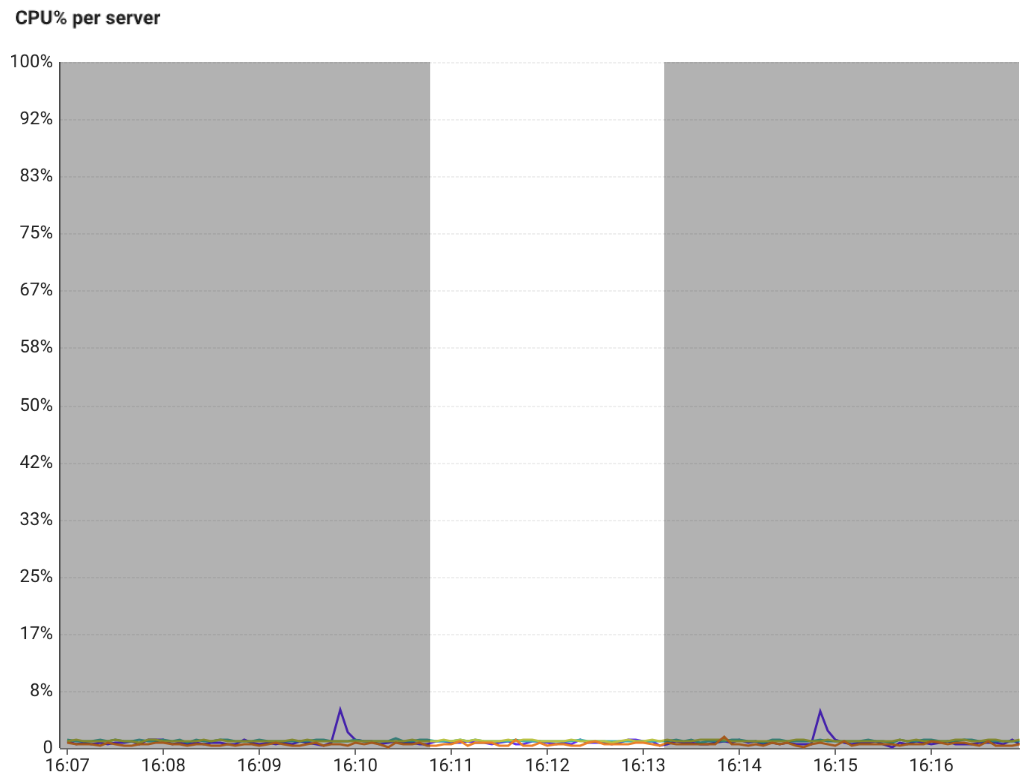
This suggests a high tendency, but not all servers displayed at the bottom are in an over-input status. For the servers with periodic peak loads, be sure to pay attention in interpretation of the charts.
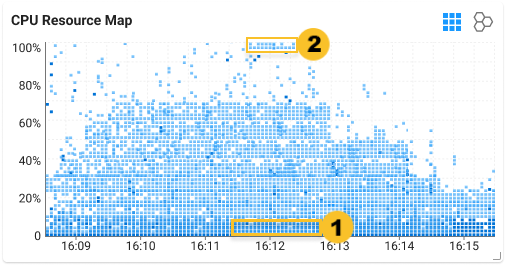
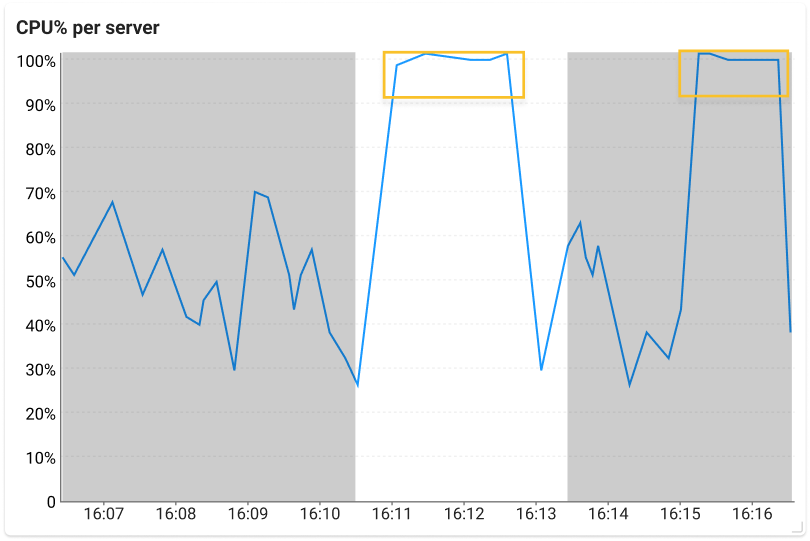
Drag the ![]() area at the top of CPU Resource Map to view the detailed information. In the CPU% per server graph, you can see the under-input tendency. The following detailed information example is a typical CPU shortage or starvation status screen, and the server is a server of interest with repeated peaks and falls.
area at the top of CPU Resource Map to view the detailed information. In the CPU% per server graph, you can see the under-input tendency. The following detailed information example is a typical CPU shortage or starvation status screen, and the server is a server of interest with repeated peaks and falls.
IT resources are subject to continual efficiency and improvement and they require constant review. WhaTap Server Monitoring reflects the know-how of engineers in visualization so that abnormal situations can be quickly identified and the processes can be viewed immediately. With CPU Resource Map, you can easily see over- and under-resource status, as well as checking key processes at a glance with top 5 resource usage list widgets, which is to be described later. Reduce unnecessary chart configuration that requires various presets and quickly view the over- and under-input status and key processes through the data-intensive WhaTap dashboards.
Early alarm and alert
WhaTap Resource Board provides a chart of top 5 lists of servers and processes with the highest resource usage. Widgets from the early alarm perspective help you identify potentially problematic servers, located on the right and bottom respectively.
When the resource usage is high, problems inevitably occur. Through Top 5 list charts, WhaTap searches the target servers with the high resource usage such as CPU, memory, disk I/O, and network that are key metrics of Server Monitoring, processes with high CPU and memory usage, and other issues to help you solve them.
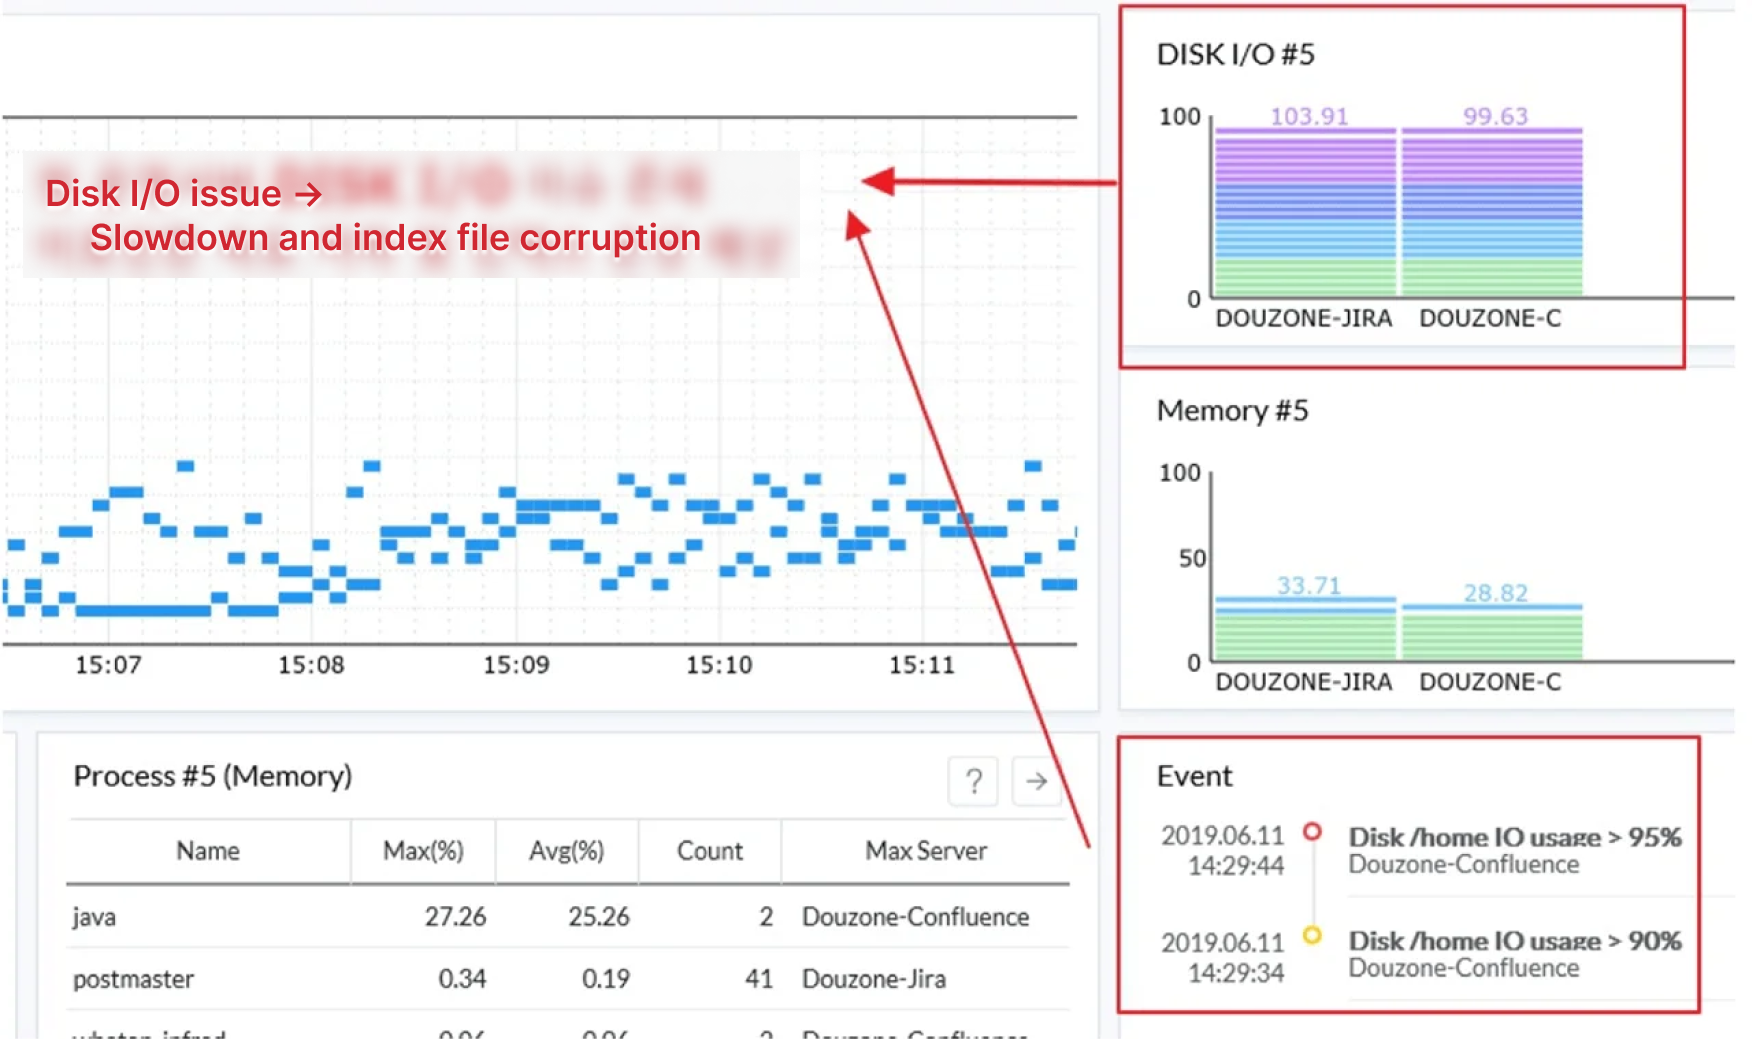
Before a bigger problem occurs, an example is to be suggested to detect a major system issue through WhaTap Resource Board. If you look at the Disk I/O Top 5 widget on the following example screen, you can see the current status of devices with the high disk I/O relative to available capacity.
As a result of reviewing the history of failures that occurred in the same equipment based on the status data of the example, you can see that abnormal situations such as slowdown and index file corruption occurred. In response, we introduced SSD and took actions to use the NAS snapshot backup for the part that was difficult to introduce in large capacity, and solved the disk I/O issue.
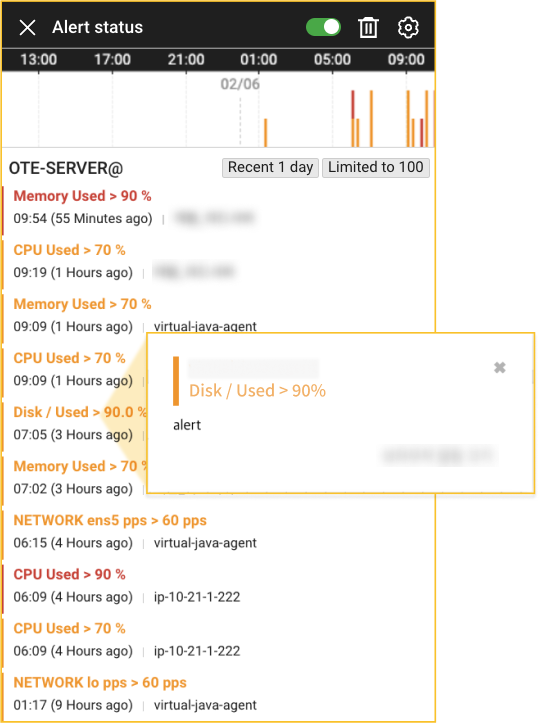
Alert Status that allows you to check the recent event trend, can be checked by selecting ![]() in the fixed menu at the top of Resource Board. WhaTap provides its own default alert threshold settings. Once the agent has been installed and data has been collected, alerts can be checked from then on without any setting. For example, the disk I/O (%) metric displays the disk utilization in 5 seconds. Disk I/O (%) above 80% can affect the system performance. Disk I/O 100% indicates that the disk is working non-stop. The default warning value setting for disk I/O (%) in WhaTap Server Monitoring is 90%. In other words, if it exceeds 90%, the alert is triggered immediately even if there is no threshold setting.
in the fixed menu at the top of Resource Board. WhaTap provides its own default alert threshold settings. Once the agent has been installed and data has been collected, alerts can be checked from then on without any setting. For example, the disk I/O (%) metric displays the disk utilization in 5 seconds. Disk I/O (%) above 80% can affect the system performance. Disk I/O 100% indicates that the disk is working non-stop. The default warning value setting for disk I/O (%) in WhaTap Server Monitoring is 90%. In other words, if it exceeds 90%, the alert is triggered immediately even if there is no threshold setting.
WhaTap's default alert settings allow you to quickly start monitoring as soon as installing the agent without any complicated steps. It is a result of adopting efficiency and user convenience, the characteristics of WhaTap Server Monitoring. For more information about the alert settings of Server Monitoring, including easy-to-set process alerts, see the following.
Resource Board is an efficient dashboard that summarizes the status information of the entire server and provides a concise and issue-oriented view. Through the main chart (CPU Resource Map) to detect the number and trend of servers with CPU issues at the same time and the Top 5 list for each key metric of OS Monitoring, the target resources with high potential for issues to occur are exposed and the alerts from the server are displayed in chronological order. WhaTap's intuitive and compact dashboard configuration is more useful when large systems need to be monitored.
Additional use of dashboards
- If
 is selected in the Top 5 widgets for each resource, the Resource Equalizer menu displays the real-time usage of all servers.
 - The detailed server-level information can be checked in the Server Detail menu, which is moved by selecting the chart area in the widget.
- To view the server resource consumption patterns or compare them with the load design, use Analysis > Metrics Chart.