Using the Instance Performance Management
The Instance Performance Management menu provides useful features for checking the application environment and managing its performance. Instance Performance Management provides detailed information on frequently used main menus and usage examples as follows.
Loaded Classes
Home > Select Project > Instance Performance Management > Loaded Classes
The Loaded Classes menu provides detailed information about the structure and method signatures for the classes loaded into the application, and also provides the Redefine feature to allow uninterrupted changes to class behaviors.
Redefine
Redefine allows you to change the behaviors of classes loaded at runtime without stopping the application by calling the redefineClasses method of Instrumentation. It is useful if you need to make modifications or changes to the running service. For example, when setting an additional transaction start point and measure the response time by specifying a new service pattern, you can find the class in the Loaded Classes list after changing the related WhaTap settings and then click the icon for Redefine.

Resources
You can view which file the class was physically loaded from through the Resource column. Due to the multi-layered nature of Java applications, it is required to check information like Resource. In complex application environments, it is important to identify exactly which jar file a class was loaded from.
Unexpected behavior or bug may occur if a specific class was loaded from the unintended jar file. This can make debugging easier, especially in complex classpaths or multi-module environments, by allowing you to see exactly which path a module was loaded from.
Thread List/Dump
Home > Select Project > Instance Performance Management > Thread List/Dump
The Thread List/Dump menu allows you to check a list of running threads and view individual snapshots and a full thread dump for those threads. Hitmap is the core of transaction response time-oriented optimization, while Thread List/Dump is the core element of CPU optimization, which plays an important role in optimizing the application performance, diagnosing problems, and maintaining stability.
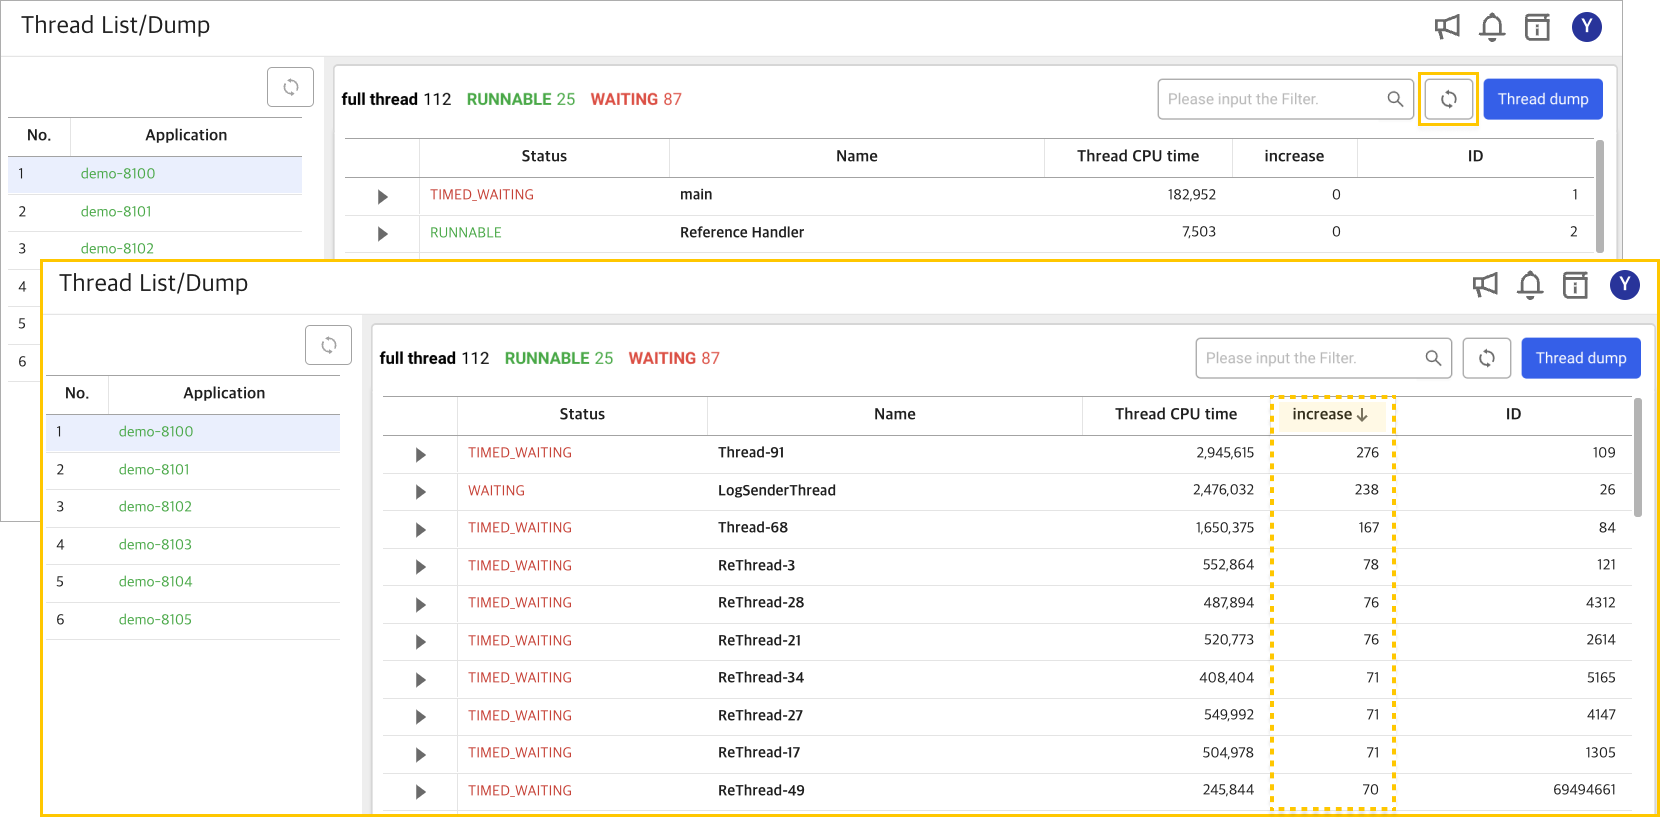
Determining which threads are using a lot of CPU is important for identifying the cause of the bottleneck. In particular, you must be able to query the time series data to identify threads that have spikes in CPU usage during a specific period. In Thread List/Dump, Thread CPU time means the total accumulated time that the thread has occupied the CPU. Upon Refresh, the difference between the current thread CPU time and the previous thread CPU time, Increment is provided, allowing you to identify the thread using the most CPU at the time of query. Click the Increment column to sort in descending order to see the thread with the highest growth.

After specifying a thread in this manner, you can check the thread snapshot to find frequently called or long-running methods. This allows early detection and response to abnormal signs, for stable management of the system.

Checking the threads with high CPU usage
A spike in application CPU usage could be due to various causes. We can categorize these issues into three types: in case the heap memory is full, in case there are lots of requests, and in case there is a logic problem.
At this time, the first thing to check is the heap memory that is easy to identify. If the heap memory is full, the JVM performs GC frequently, which may cause CPU usage to spike. In this case, you can easily check it through the Heap Memory graph of Application dashboard. If there are lots of requests actually where the applications process a large number of client requests, it results in high CPU usage. Each request is processed by creating a Java thread, causing the CPU to perform a lot of work. In this case, you can check through the TPS-related metrics in Application dashboard.
If the application code contains inefficient algorithms or infinite loops, it may abnormally result in a high CPU usage. In this case, you can specify the thread with high CPU usage through the Thread List/Dump menu and then check the thread dump to find the problematic code.
Check Thread CPU time → Refresh → Sort the list by Increment → Identify threads with high CPU usage