Exploring the hitmap transaction
This document explains how to find problems of the web application server and response to failures by using the Hitmap Transaction among the WhaTap Monitoring Service functions.
The staff of Application Monitoring has different items to monitor depending on the field of work. Server administrators monitor resources such as CPU, memory, disk, and network, and want to know how much they are using. DB staff wants to see the metrics to improve the DB query performance.
On the other hand, in the traditional monitoring methods, the service (AP) staff only checks heap usage and CPU usage. However, in this way, it is not possible to know what the problem is with the service (AP). The most important thing in the service (AP) is whether to respond to user requests properly, quickly, and without errors. For this purpose, we need to verify that the user request has been properly performed. Each user request is called "request," and the process to handle this request in the server and respond to the request is defined as transaction.
In the WhaTap monitoring service, you can see the failure status of the service (AP) by dividing transactions into "transactions in progress" and "completed transactions." In the Hitmap widget of Application Dashboard, you can check individual completed transactions in a distribution chart. A hitmap chart is the widget that collects transaction data that ended at an interval of 5 seconds and expresses them in dots. Through this chart, we can analyze the causes of failures by finding the transactions that should take 1 second took around 2 seconds, more than twice the response time.
Pattern Analysis
Let's look at how to determine which type of failure has occurred depending on the shape of the distribution chart.
HITMAP Transaction is the chart that displays the response time to user requests in a distribution chart over time. In Application Dashboard, select ![]() at the upper right of the hitmap widget to enter the Analysis > HITMAP menu.
at the upper right of the hitmap widget to enter the Analysis > HITMAP menu.
![]()
The horizontal axis is the transaction end time, and the vertical axis is the response time. The response times to the user requests appear as rectangles on the chart for each time the transactions end. This allows you to determine whether the user request has been properly responded to. The colors of the square boxes on the hitmap transaction chart have the following meanings.
- Blue: Normal transaction
- Orange, Red: An error occurred or the request was denied. The displayed color gets closer to red, depending on the frequency of errors.
The most important part to look at in this chart is where the transaction boxes are lined up horizontally or vertically. See the following hitmap pattern.

Pattern in which vertical lines appear temporarily. If a vertical line occurs, it indicates that the response times of each transaction are different, but the end times are the same. If a lock occurs temporarily during processing the transactions, the transaction process is queued. When the lock is released, the queued transactions are terminated all at once in a similar time. This situation creates vertical lines.
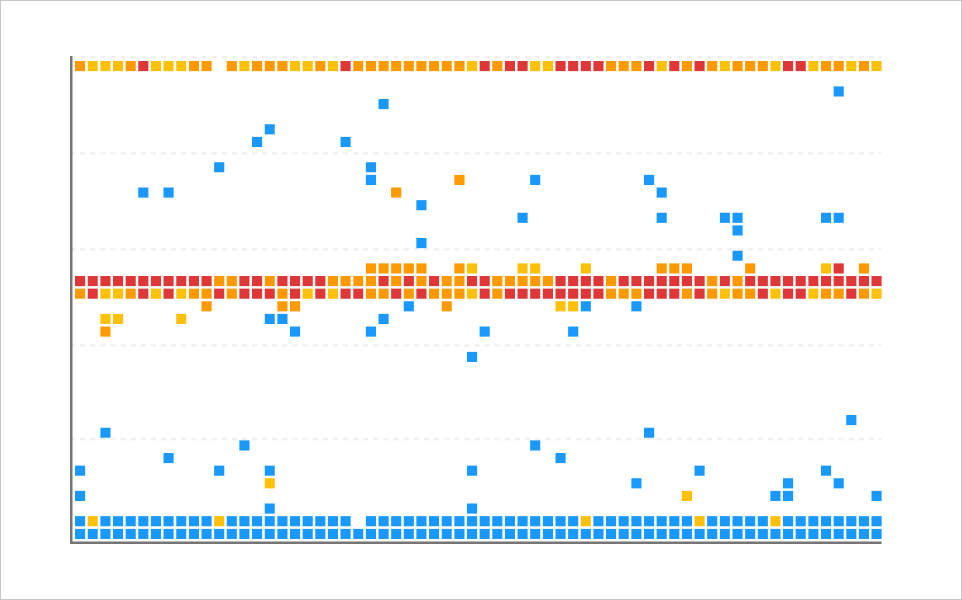
Pattern with horizontal lines. In a 10 second timeout condition, if the resource is insufficient, many transactions wait for 10 seconds and then generate timeout errors. At this time, a horizontal line appears near 10 seconds of the hitmap. If there is a logic to retry after timeout, the horizontal lines repeat every 10 seconds as shown in the figure above.
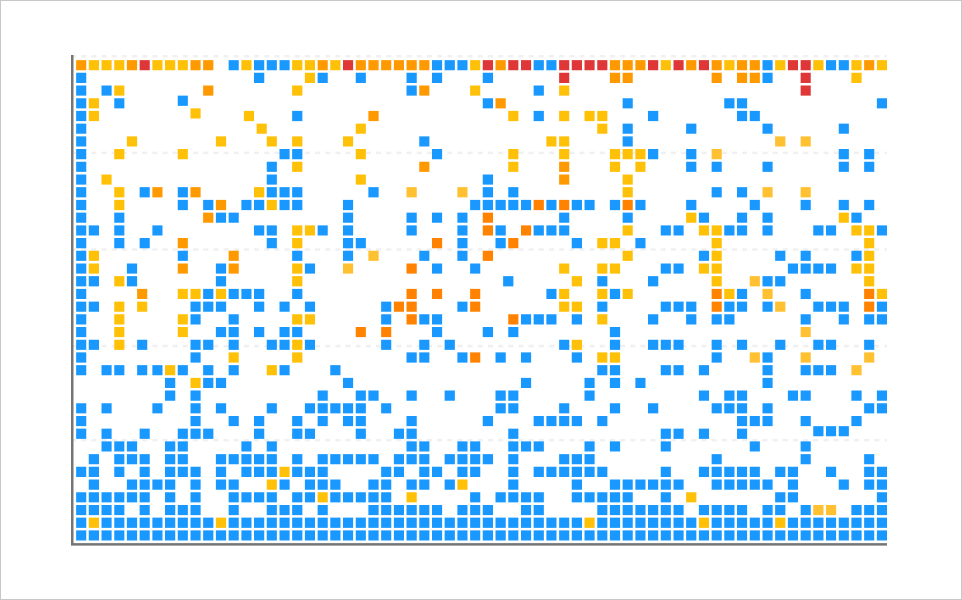
Flying pattern that looks like waves is the pattern that appears at intervals due to lack of specific resources or common resources such as logs.
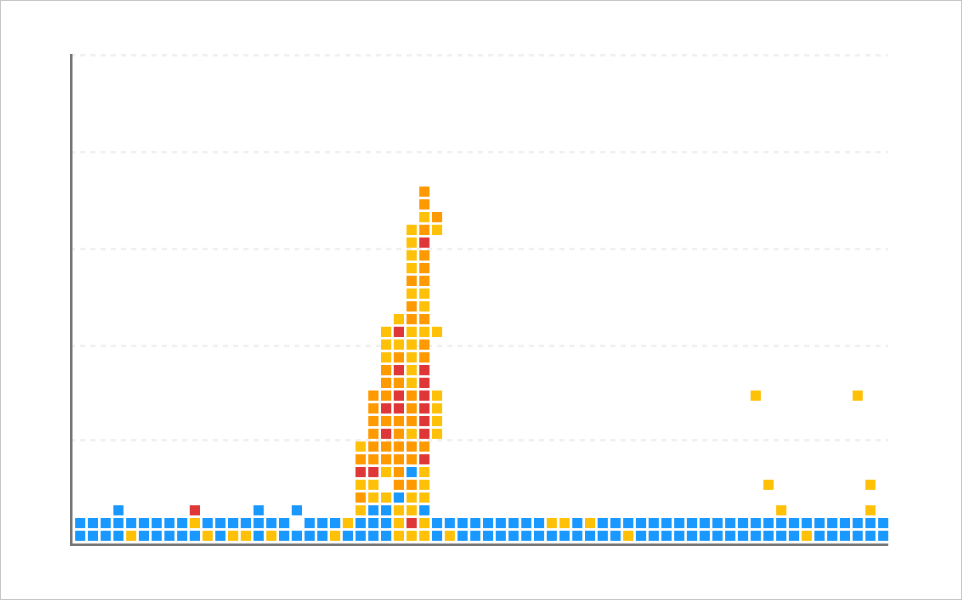
Overload pattern is the pattern that occurs when there is a high concentration of transactions that is temporarily caused by some or all of the response failures.
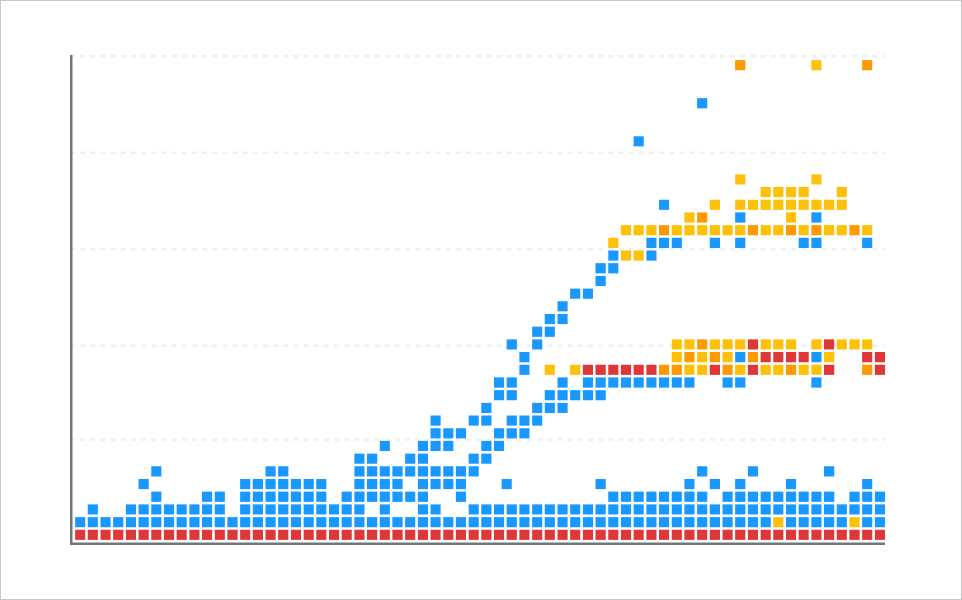
Flood pattern is the pattern in which the overall response times increase upon excessive transaction requests or loads.
When a pattern occurs, it is important to determine whether the factor of the server causing the pattern is internal or external. Assume that you have designed your system with the structure shown in the following figure.
![]()
In the lower part of the chart, there are mostly transactions with fast response times. Accordingly, finding patterns is meaningless. You have to find common factors of the pattern caused in the slow section of the above area. When a vertical line pattern occurs and a lock occurs in the service (AP), the pattern occurs only in a web application. On the contrary, if a lock occurs in an externally connected database, the pattern occurs in all web applications.
![]()
If you drag the chart area, the transaction information of the dragged area appears in the TX Trace list at the bottom. The Application widget on the right groups agents and displays them in a list.
Because we are intended to find common factors of failures, first check whether problems have occurred in the same application or URL. Otherwise, you can also check whether the client IPs are the same.
Analysis of sections and stacks
How can we check if the cause of failure is an internal issue rather than an external one? WhaTap uses the technology called Active Stack to collect stack data of active transactions. Stack data is collected every 10 seconds, and the collected data can be checked in the statistics. It also includes the data of each method, SQL, and outbound call that perform the service logic.
If it is an internal problem, you can find and solve any problem by checking the execution history of transactions over time and identifying the slowdown section. If it is an external problem, you can check the SQL and outbound call data.
For example, to find any factor that causes a lock in a vertical line pattern, check the contact points between the slowest transaction and the fastest transaction in the same pattern. Drag the area where the pattern occurs on the HITMAP transaction chart. The TX Trace list displays the transactions of the area dragged to the list. Sort the TX traces by the elapsed time, and then select the transaction that took the longest. The Transaction information window displays information details of the selected transaction.
![]()
In the Table View tab, you can check the Time and Elapsed. Time is the time when each step started or ended, and Elapsed is the total time from the start to the end of each method. Gap is the interval between executed methods.
![]()
You can find the slowed section in the Table view tab. In the same way, check the slowed section in the fastest transaction. You may find any common factors. If the slowed section was caused by the service (AP) logic, check the Active stack. If you select Active stack, the detailed information window appears. Check the correlation between the active stack and the previously executed method in the Tree View tab. If you click the section on the timeline bar, the expanded information appears for the selected section.
-
Active stack saves snapshots every 10 seconds, so you can check them at any section. Because the probability increases when identifying the section where the response time can be long, you can find the point where the section has been widened through the active stack.
-
In the TX trace list, the transactions that include the active stack displays the A icon.
If you see the transactions in the hitmap chart, you can find the related transactions. By checking the transactions, find the factors that affect the response time or end time. By tracing all methods in the application, you can perform section analysis, but it may cause distortion in the response time, resulting in overhead. That is why you must only trace the selected class methods. This selection is determined only from the administrator's point of view, but locks and other factors causing failures can be excluded. The active stack technology assists this weak point.
WhaTap monitoring service repeatedly snapshots the active stack to find recurring problems while running the application server. This helps find the key factor causing failures with a high probability. Analysis > Stack is the menu that can statistically check the collected data. For more information about the stack, see the following.
-
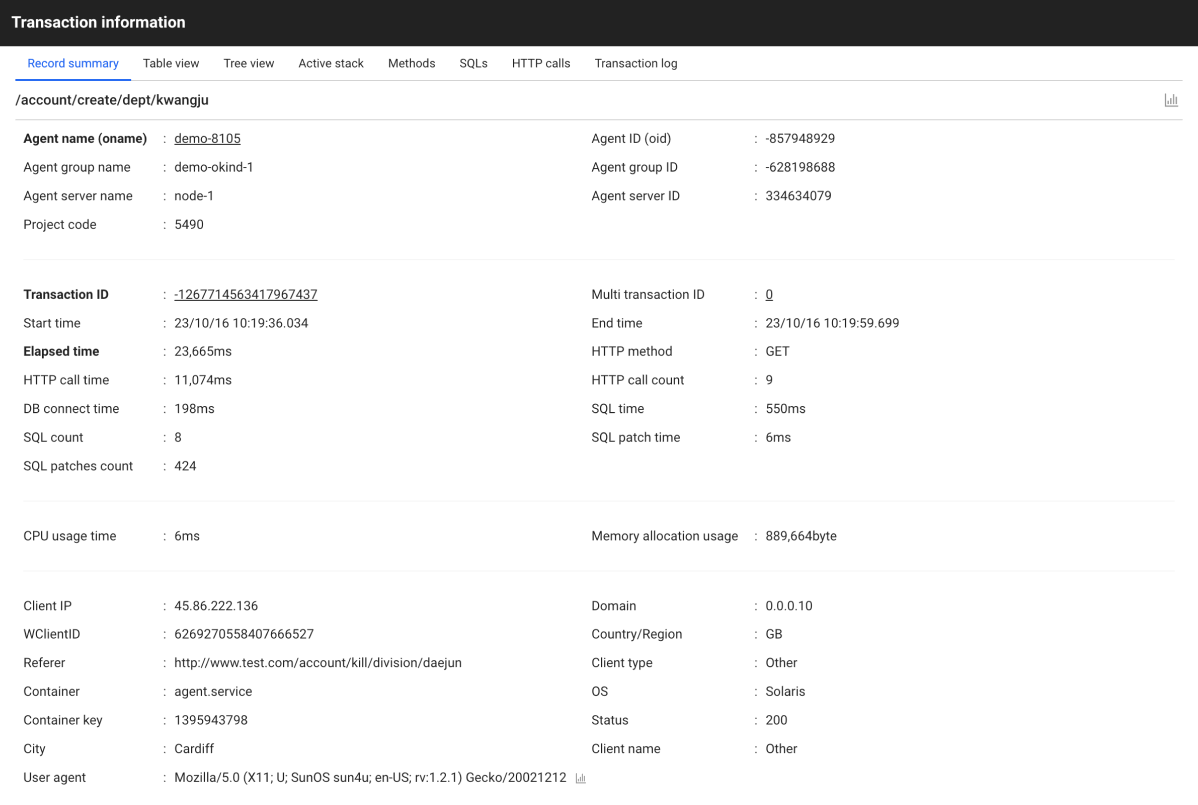
Select Record summary in the Transaction information window, the basic information of the transaction appears. It displays the client IP, used device, OS, country, and such. You can also see how many calls are being used by looking at the number and times of patches, the number and times of SQLs, and more.
-
For more information about Transaction information, see the following.
Analysis of call relationship
-
Methods
Select Methods tab. Like SQL, you can also see how many times a method was called within a single transaction.
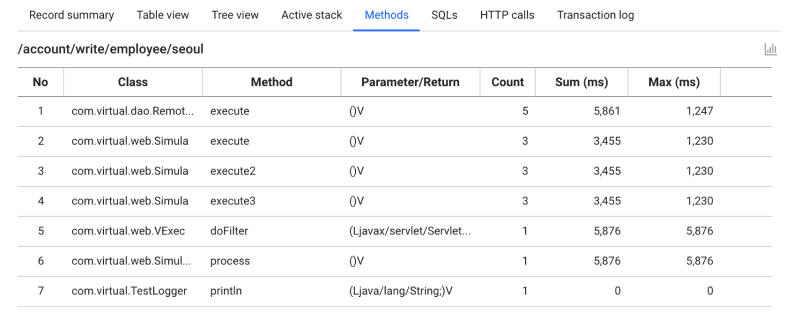
Based on this information, you can check whether there are methods that have been repeatedly executed and the same method has been called repeatedly to find improvements.
-
SQLs
Let's look at the case where the cause of failure is SQL, not internal logic. To see the SQL executions statistically within a single transaction, select the SQLs tab.
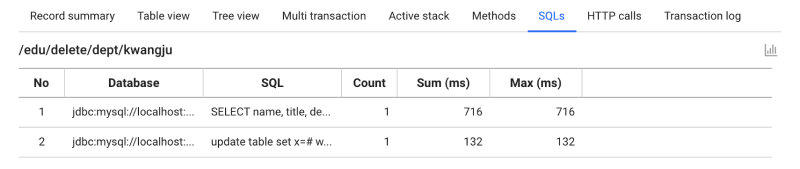
Check how many times the same SQL has been called. Find the way to reduce the burden on the DB by decreasing the number of calls in the logic or find another workaround. Reducing the burden on the database is very important for server operation. The application server can be scale out. You can continuously increase the resources. On the other hand, splitting a database entails a huge amount of application redevelopment. The basis of performance tuning should be in the direction of reducing the burden on the database in the application as much as possible.
-
HTTP Calls
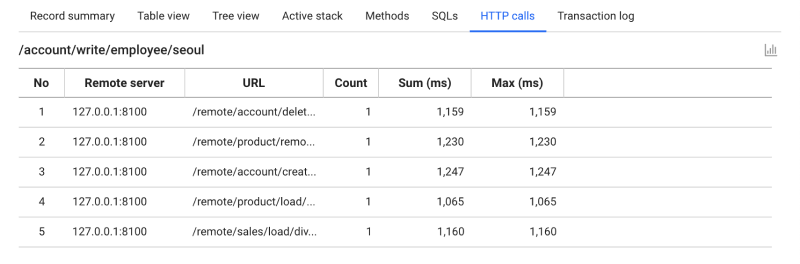
Select the HTTP Calls tab. It provides the number of calls, total time, and average time for HTTP calls.
-
Multi-transaction
The monolithic environment has a single APM configuration. In this case, check only the transactions for the APM. Recently, the technology like microservice architecture has become mainstream. Because a single APM is broken down into smaller chunks, the transactions that must be collected also increase. In this case, collecting all the splitted transactions takes much load, so the transactions related to a targeet transaction are also collected together. The transactions linked to other APMs are defined by WhaTap as multi-transaction. In the TX trace list, the transactions that include multi-transactions display the M icon.
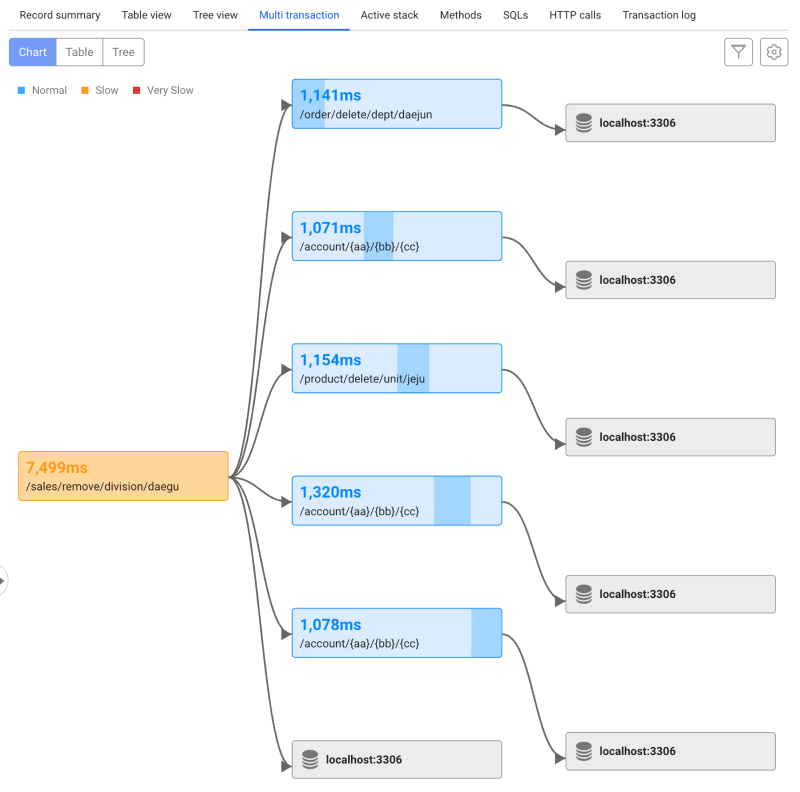
Select the Multi-transaction tab. The data for each transaction can be seen on the chart. You can select Table and Tree to see the call relationships between transactions in a table or tree structure format.
Note-
For more information about the multi-transaction trace, see the following.
-
Depending on the transaction, the Multi transaction tab may not be available.
-
Analysis of transaction logs
![]()
In the Transaction Log tab, you can also find further improvements through the logs left while the transaction is running.
For more information about transaction log, see the following.
Finishing
Check the patterns and common factors in Hitmap Transaction. Analyze the method section through the identified common factors. If the section information is insufficient, obtain additional information through Active Stack. Then check the SQLs, methods, and HTTP calls to find improvements for repetitive and burdensome logics. Through the Hitmap Transaction of the WhaTap monitoring service, you can improve the efficiency for monitoring to the next level.