Heap memory metrics alert configuration
See the following Java official documentation link.
The heap memory-related metrics and their alert configurations for the application project are described.
Heap memory metrics
Heap memory is a data storage space allocated by the Java Virtual Machine (JVM) to run programs and stores key data such as instances and arrays. The heap area is closely related with the instance life cycle and GC. GC is the task of releasing unnecessary instances from the heap area to secure free space in the heap area.
Through heap memory-related metrics, you can check the maximum heap memories and current heap memories for each server to check the risk level. Additionally, you can determine the deviation between the maximum value and the current value to set the heap memory appropriately. If the minimum value for heap memory usage continues to rise, you may suspect a memory leak.
Metrics Search
Home > Select Project > Sitemap > Analysis > Metrics Search
The heap memory-related metrics are described that can be seen in Metrics search.
Heap Memory
You can check it after selecting the app_proc_counter category.
-
Heap commit
heap_committedThis indicates the heap memory committed for use by the JVM.
-
Initial Heap
heap_initThis indicates the initial heap memory that the JVM requests to the OS for memory control.
-
Maximum heap size
heap_maxThis indicates the maximum heap memory that the JVM can use for memory control.
-
Heap use
heap_usedThis indicates the heap memory being used by the JVM.
-
Total heap usage
heap_totIt indicates the total heap memory allocated to the JVM.
Non-heap Memory
You can check it after selecting the java_memory category.
-
Heap commit
nonheap_committedThis indicates the initial non-heap memory that the JVM requests to the OS for memory control.
-
Initial Non-heap
nonheap_initThis indicates the initial non-heap memory that the JVM requests to the OS for memory control.
-
Non-heap total usage
nonheap_maxThis indicates the maximum non-heap memory usage that the JVM can use for memory control.
NoteIf the maximum memory sizes for metaspace and JIT code cache are not defined, it returns
-1. -
Non-heap use
nonheap_usedThis indicates the non-heap memory used by the JVM.
Metrics Chart
Home > Select Project > Analysis > Metrics Chart
The heap memory-related metrics are described that can be seen in Metrics chart.
-
Maximum heap size
heap_maxThis indicates the maximum heap memory that the JVM can use for memory control.
-
Total heap usage
heap_totIt indicates the total heap memory allocated to the JVM.
-
Heap use
heap_useThis indicates the heap memory being used by the JVM.
-
Heap perm area usage
heap_permThis indicates the memory usage in the Perm area.
-
Heap pending finalization count
heap_pending_finalizationThis indicates the approximate number of objects waiting for finalization.
For more information about application metrics, see the following.
Heap memory metrics alert configuration
Home > Select Project > Alert > Select Metrics tab
To use the heap memory-related alerts, configure the metrics alerts. Metrics alert notifications allow for more specific and complex alert settings rather than basic alerts. For more information, see the following. The following example explains how to configure the metrics alerts based on the heap memory usage (heap_used).
-
In Alert > Event Setting, select the Metrics tab.
-
Select + Add Alert Policy on the upper right of the screen.
-
In the
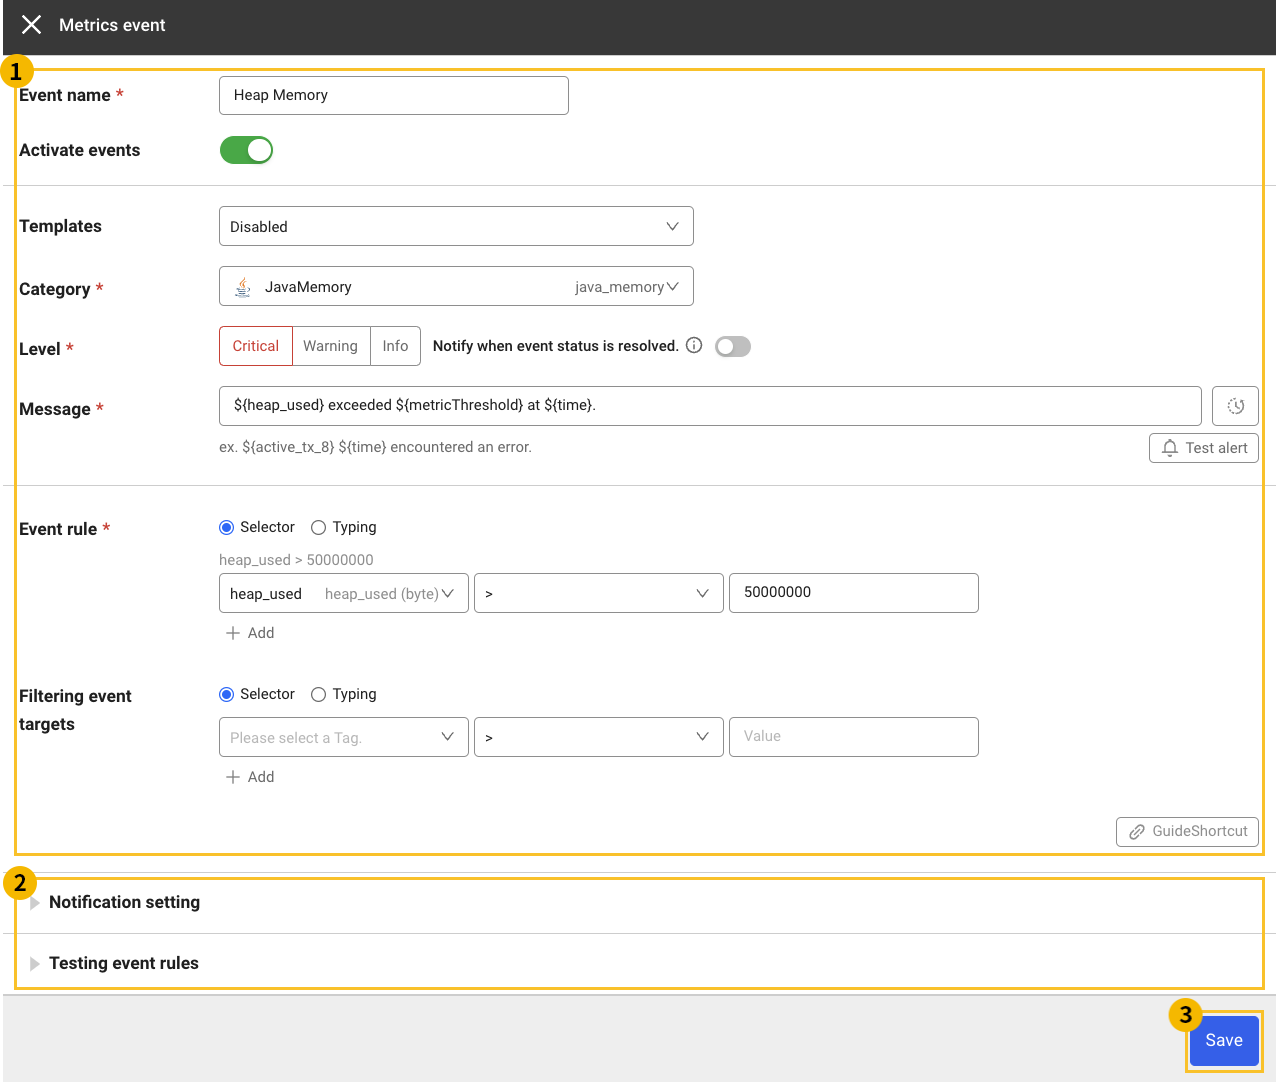
 area on the Metrics event window, configure settings for Event name, Category, Level, Message, Event rule, and the like.
-
Enter the Event name.
Heap Memory
-
Level indicates the alert level of the occurred event. Set the level. The default value is Critical.
-
Select JavaMemory (
java_memory) in the Category field. -
Enter the event message. In case of the example message, when the heap memory usage exceeds the set threshold, it is sent along with the time of the occurred event.
${heap_used}exceeded${metricThreshold}at${time}. -
Enter the fields, operators, and thresholds to set the event rule. An example of conditions that trigger an alert when the heap usage exceeds 50,000,000 bytes is as follows:
Field
heap_used, operator>, threshold50000000
-
-
In the
 area, set the detailed requirements for
  event reception, and then test the event alert rules
  .
.
-
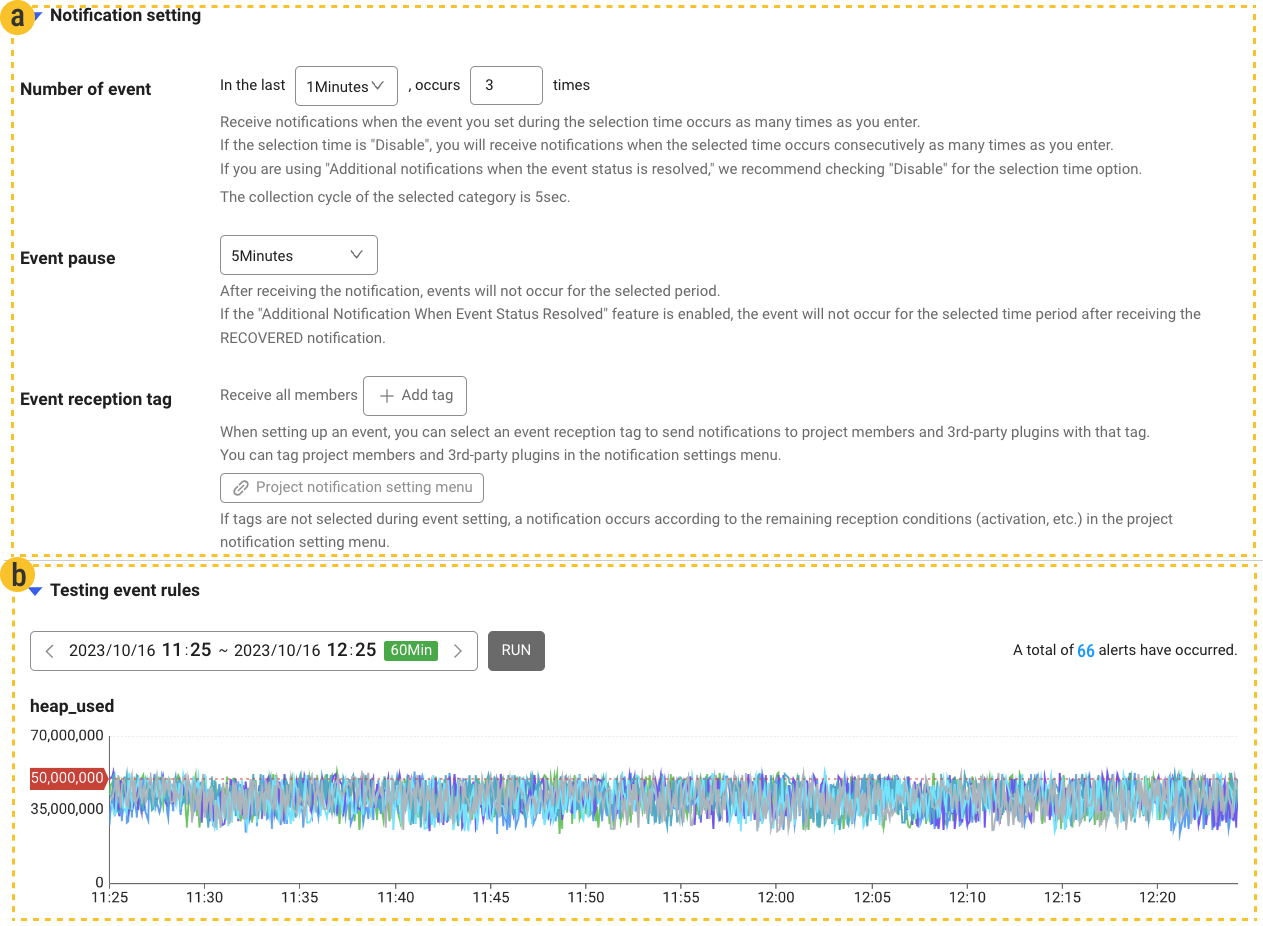
Notification setting
-
Number of event allows you to receive alerts when the event has occurred
n'times in the lastnperiod.The alert is sent when the event occurs
3times in the last1minute. -
Event pause prevents the same alert from occurring for the set time after the alert occurred.
-
-
The Testing event rules option allows you to see how many alerts were triggered when setting alerts for the event during the selected period.
During the last
60 minutes, the total number of alerts whose heap memory usage (heap_used) of more than3times in a row exceeded50,000,000bytes within1 minuteis 66.
-
-
Select
 Save at the bottom of the Metrics event window to end the alert configuration.
Heap memory usage checking
Home > Select Project > Analysis > Metrics Chart
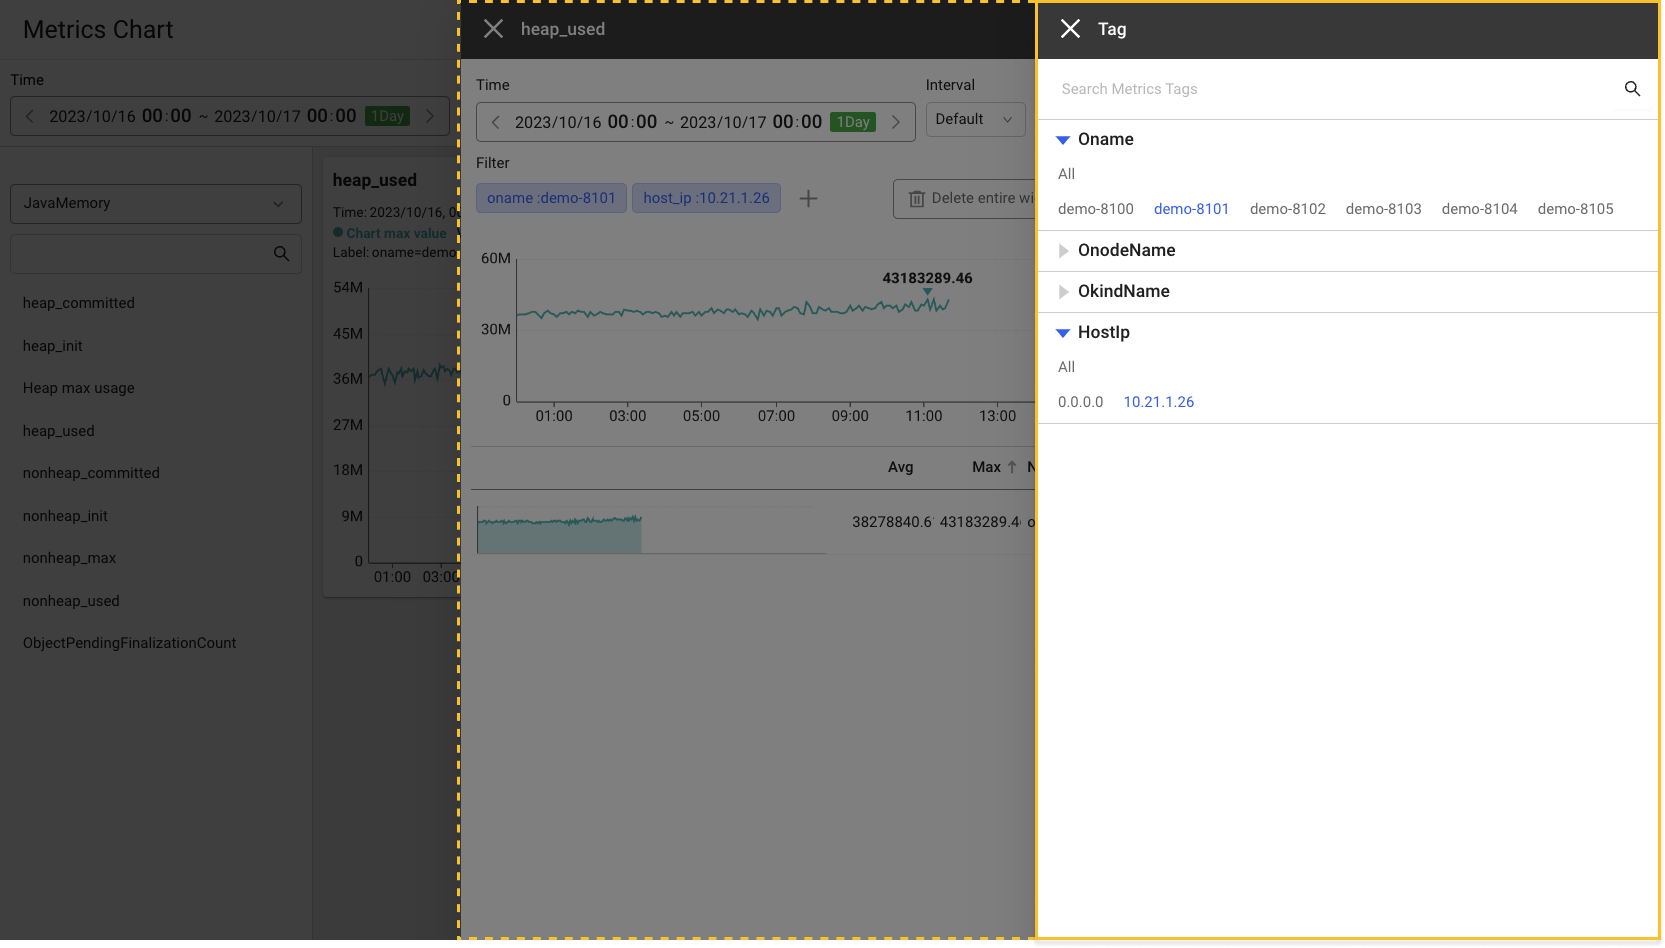
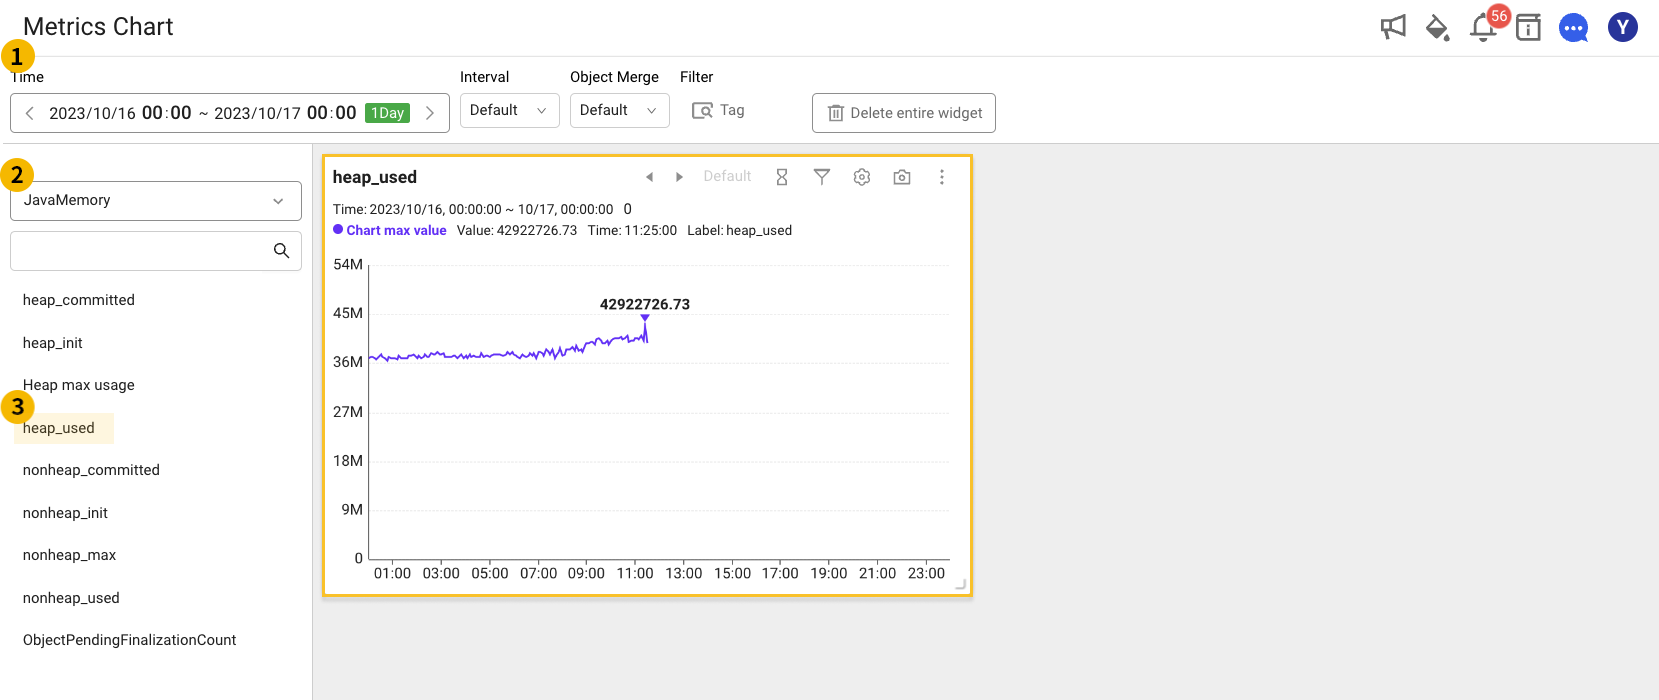
To check the heap memory usage (heap_used) in detail for the selected period, go to Metrics chart.
-
Through the
time selector at the top, select a time to view. -
From the metrics list on the left, select JavaMemory (
java_memory) for the Category. -
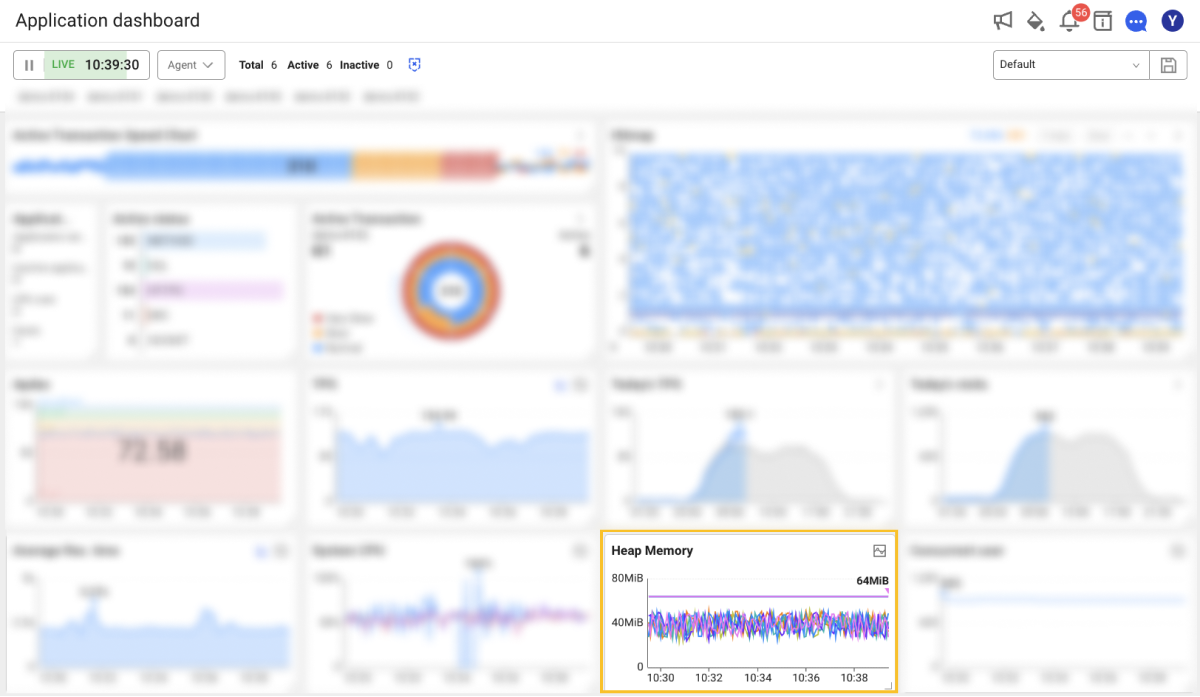
Under the
JavaMemory category, select heap_used. In the chart area, you can see the heap memory usage chart as shown in the example. -
Click More on the upper right of the
heap_usedwidget, and then select Detail in the option menu. Then each metrics trend can be viewed for the monitoring targets.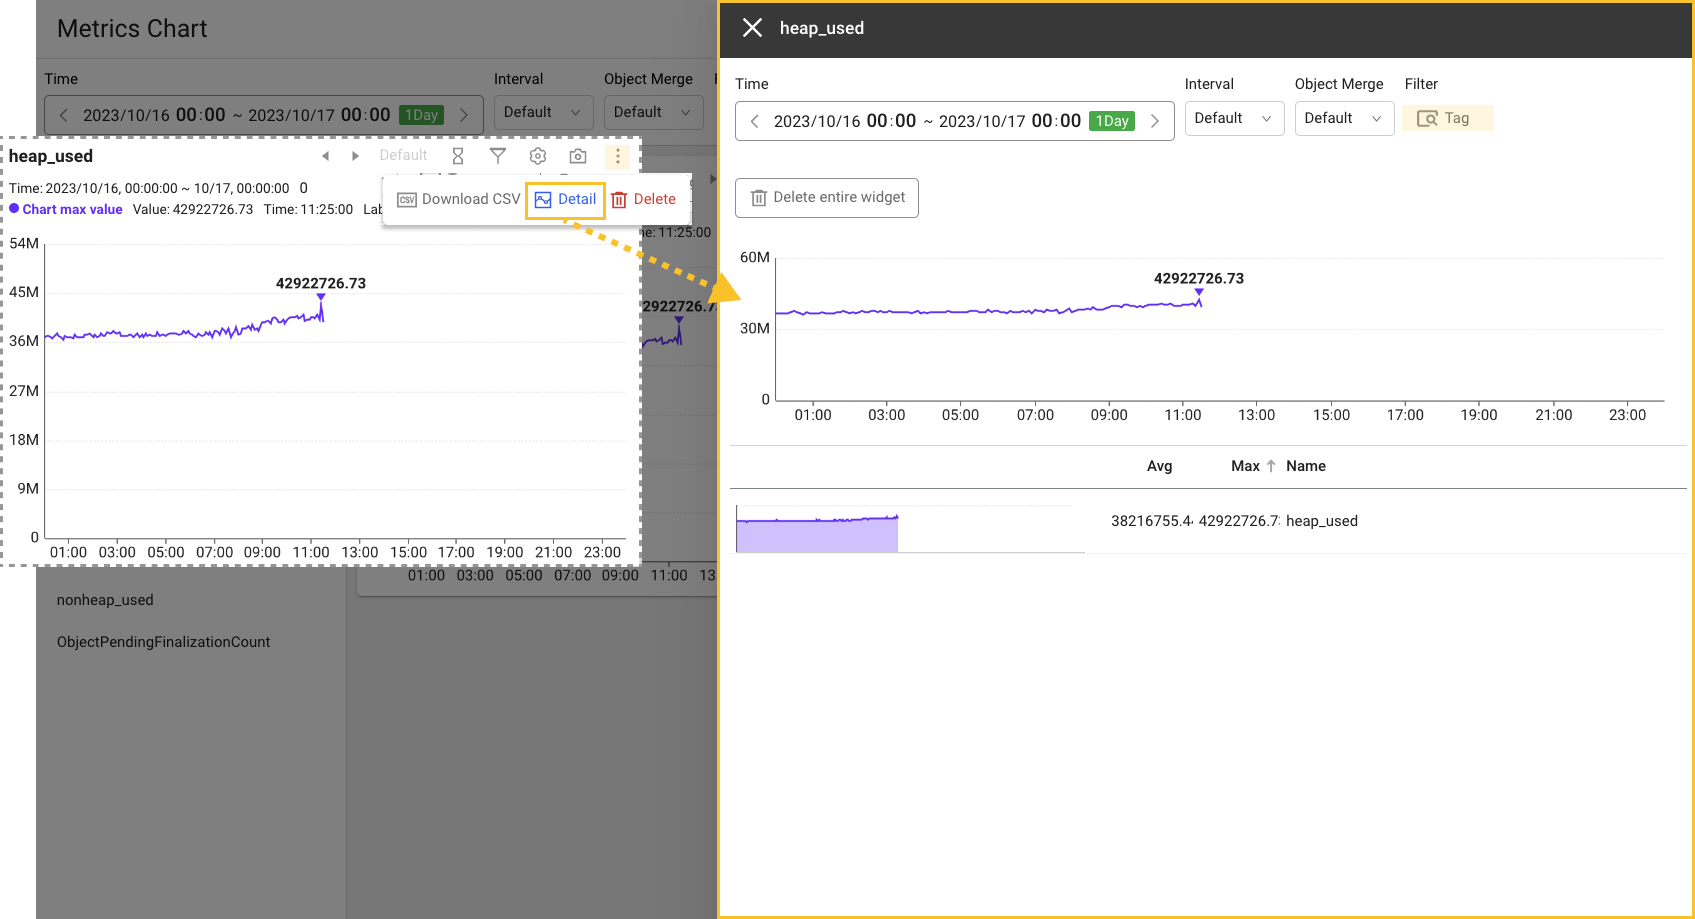
-
Select Tag filter, then you can see individual charts by selecting values for agent, agent group, agent host, and the like.