DB connection delay and connection pool
This document introduces the correlations between DB connection delay (DBC delay) that is one of application performance failures, and the connection pool from the monitoring perspective.
First, assuming that the failure situation has been recognized through the Hitmap widget on the dashboard, go to the Hitmap menu under the Analysis menu to specify the time to look at the before and after of the failure situation. Based on this, let's look at the process of inferring the cause of the failure through the Trace information window and Metrics chart.
Learning in advance
Application dashboard → HITMAP transaction → Trace information → Metrics chart
-
If you have recognized the problem, check the past records to see before and after the problem situation. After checking the transaction overload pattern in the Hitmap transaction chart, you can consider the cause of transaction delay as DB connection problem through the TX trace list.
-
After searching for each section, let's look at the detailed execution history step by step through trace analysis. We can see that the DBC step took the most of the elapsed time.
-
Let's look at various metrics together through the metrics chart. By comparing the DB pool count and DB active count charts, you can determine that the cause is the shortage of DB connection pool.
-
Depending on the operating environment, you can gradually adjust the connection pool size or configure the optimization settings to prevent water leak.
Detecting the hitmap anomaly pattern
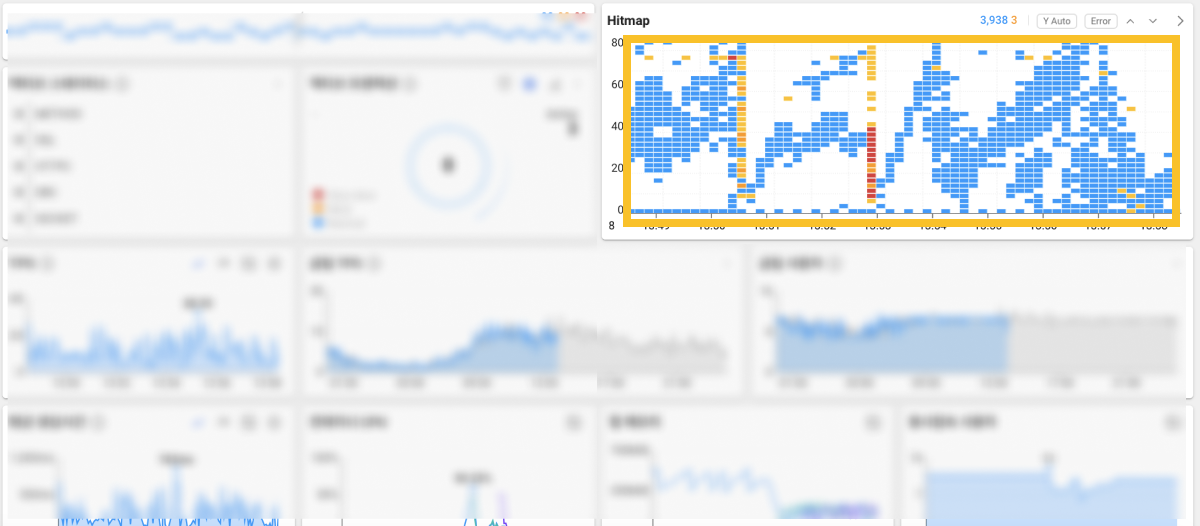
Speed is the key to recognizing failures and tracing their causes through primary analysis. WhaTap provides an intuitive view and the history search function to obtain additional information for root causes. If a sudden abnormality is detected as in the example in the Hitmap widget on Application dashboard, what is the next step?
You can quickly perform the transaction trace analysis by dragging the problem section in the Hitmap widget, or move to Hitmap under the Analysis menu to expand the time range to look at before and after the problem situation.
Let's proceed with the latter route. The dashboard hitmap widget is a distribution chart of transaction response times completed in the last 10 minutes. In other words, to check the past history for the last 10 minutes or more by specifying the time range, go to Hitmap under the Analysis menu. You can move as shown in the example by selecting the ![]() arrow icon on the upper right of the widget.
arrow icon on the upper right of the widget.
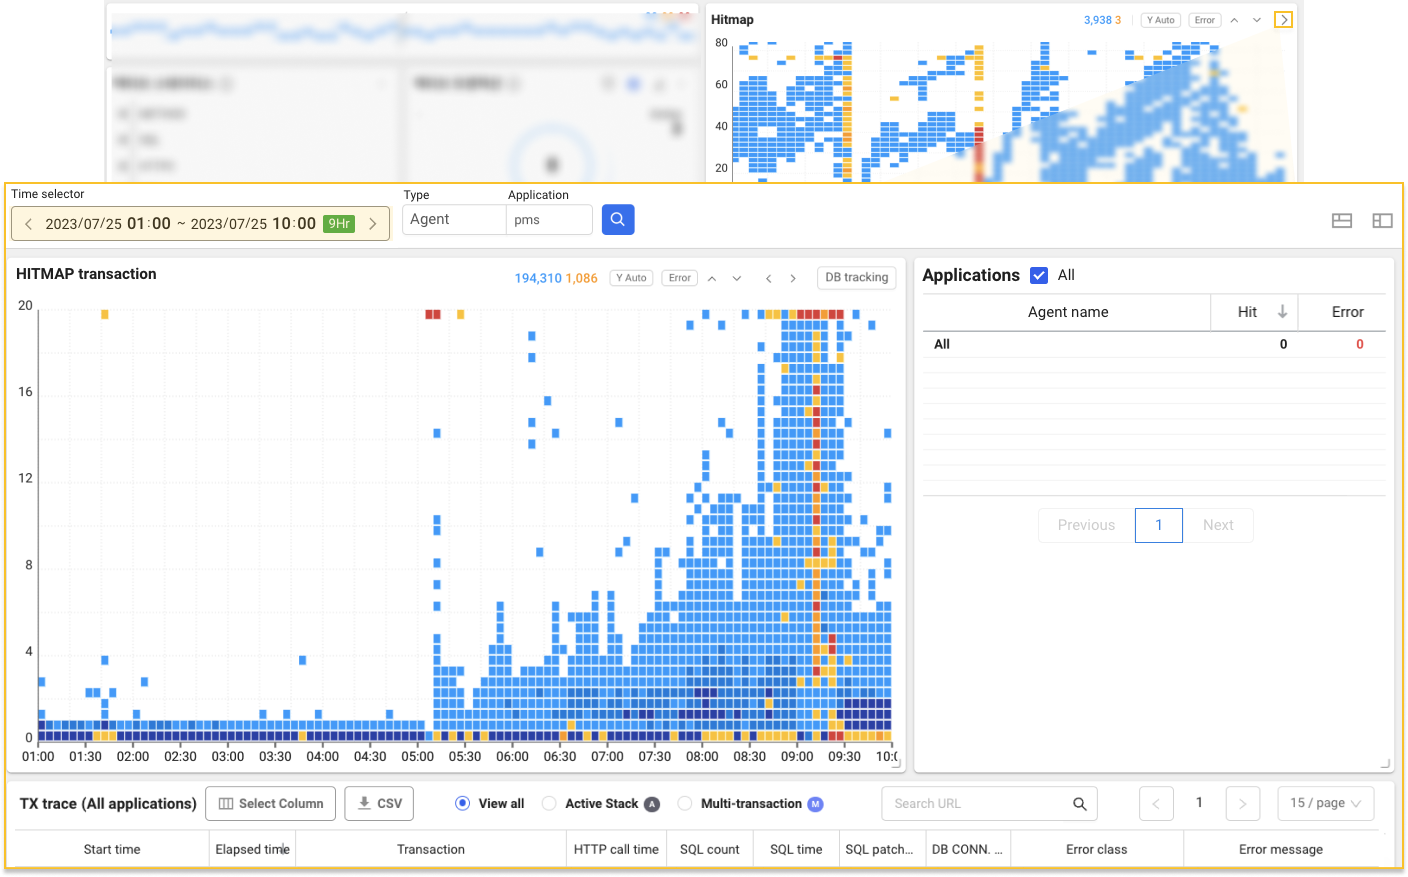
Through the time selector at the top of HITMAP transaction, you can search for the past history by specifying the desired time range. To confirm abnormal patterns, we searched widely before and after the problem section and could identify an overload pattern with a high concentration of transactions with delayed responses.
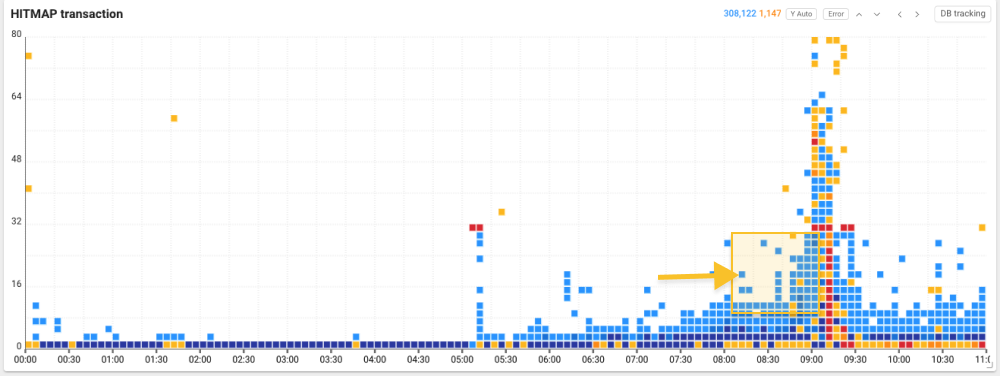
To find the cause of this sudden increase in response time and transaction overload, drag each problem section on the Hitmap transaction chart to view the transaction trace list (TX trace list).
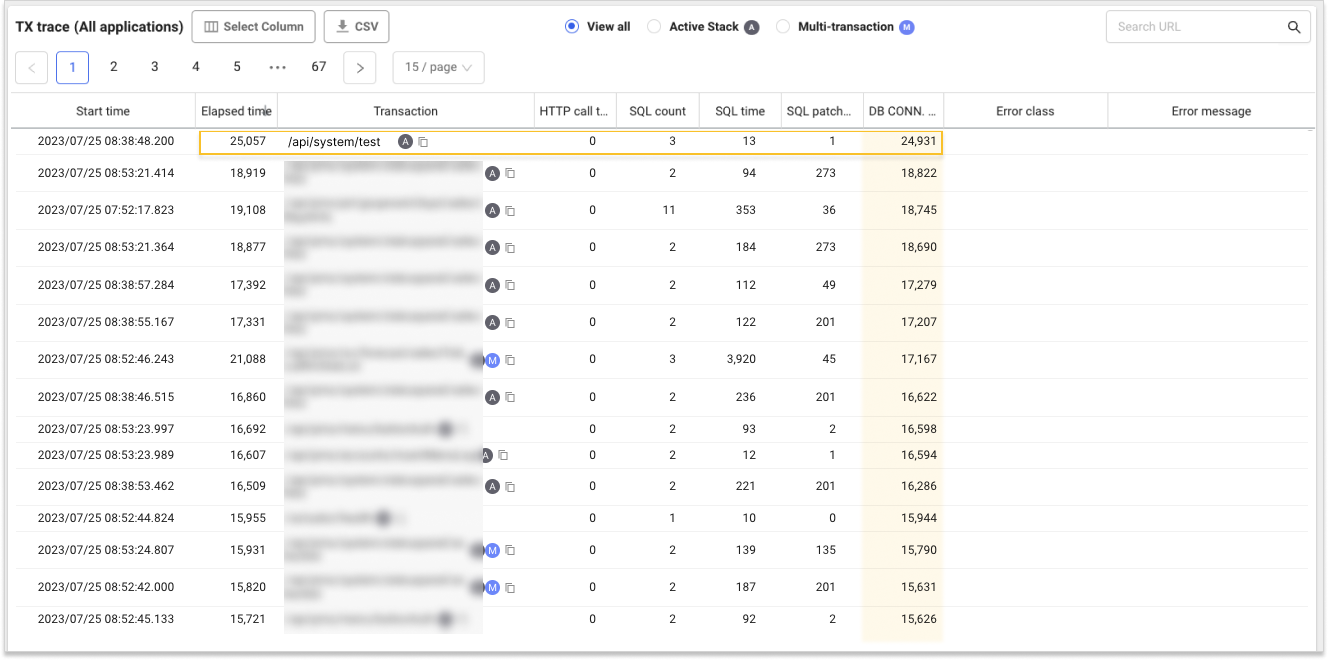
Through the TX trace list, you can see that the ratio of DB connect time to Elapsed time is great in many transactions. For example, in case of /api/system/test URL, of the total elapsed time of 25,057 ms, only the DB connection took 24,931 ms. In other words, we can assume that there is a problem primarily with the DB connection. Next, select the transaction and then look at the details in the Transaction information window.
-
The horizontal axis of the hitmap indicates the transaction end time, and the vertical axis the response time. You can view the response time delay section on the vertical axis up to 80 seconds by selecting the
 arrow icon on the hitmap.
 -
For more information about the analysis on hitmap patterns other than overload patterns, see the following.
Analysis on the transaction trace
In the Trace information window, you can see the transaction performance history by step. Through this transaction tracing, you can trace the causes of poor performance or errors in transactions. When viewing the Trace analysis window, the information for you to look at first is the elapsed times for each step. This is because comparing the elapsed times allows you to quickly identify the cause of poor performance or errors.
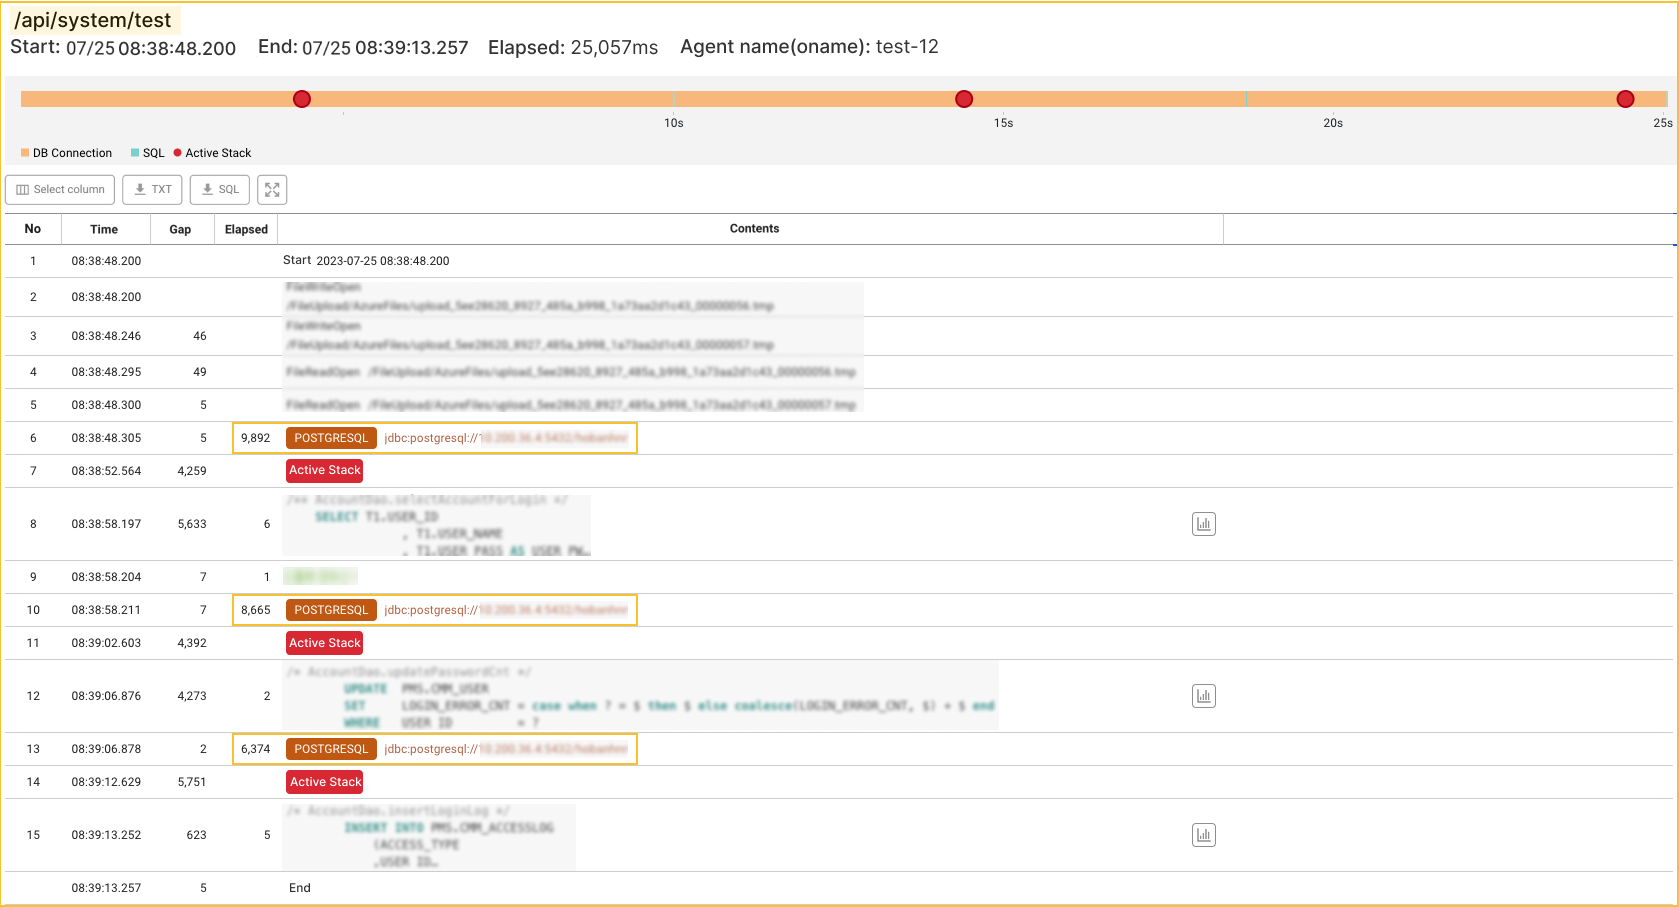
Let's look at the detailed trace of the URL. The query execution time that connects the PostgreSQL DB while running /api/system/test is between 1 ms and 6 ms. Accordingly, there is no critical problem. However, you can find that the waiting time for DB connection is significantly longer than the time, and the DB Connection step is the longest elapsed time.
In other words, in this case, the transaction delay occurred due to the DB connection delay, as assumed earlier. What causes this DB connection delay?
Checking the DB connection pool
One of the causes of DB connection delay is the shortage of connection pool. The connection pool size means the number of connections that can be made simultaneously. The database consumes lots of time while creating and ending connections based on the requests. The connection pool creates a specific number of connections in advance and makes the current connection pool reused when other requests occur. This can decrease the response time because creating connection is not required each time. The problem is that the number of pre-created connections is insufficient compared to the number of connections required by the application. In this case, a delay in DB connection is followed.
To check the status of the DB connection pool, go to Metrics chart in the Analysis menu. First, select Database from the list on the left of Metrics chart, and then check the DB pool count and DB active count charts.
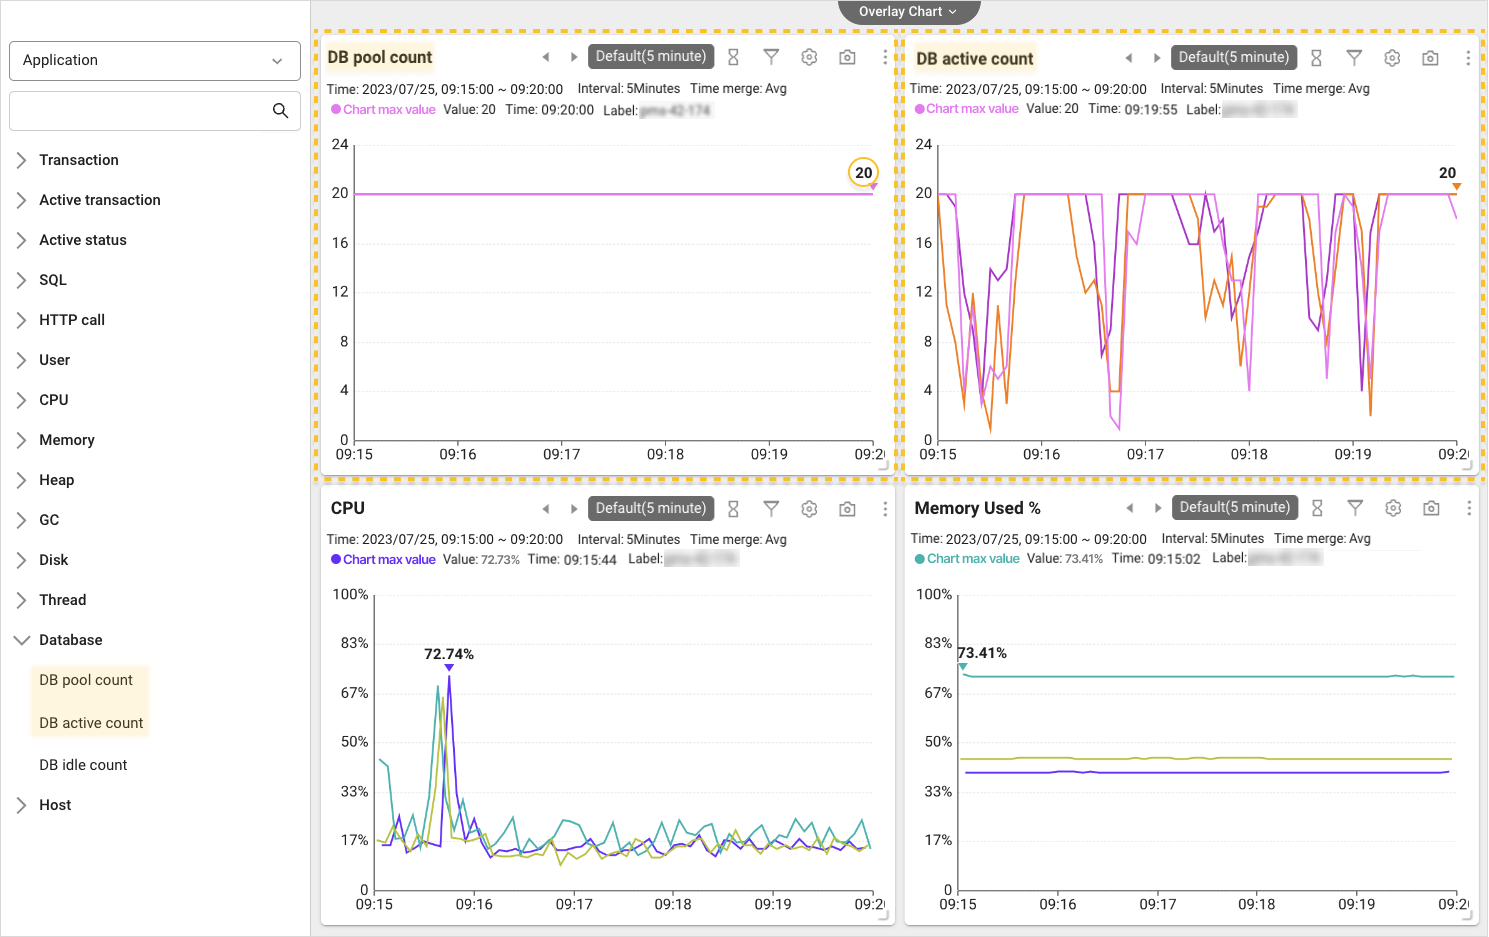
As you can see in each chart, the maximum number of connections for DB Pool is set to 20. If you look at the DB active count chart, you can see that 20 pools are continuously occupied. If the requests that exceed the specified pool count are raised, a delay is followed until there is any remaining pool in the DB. When checking the resource status such as CPU and memory usage, there were no special happenings. In other words, in case of this project, the shortage in DB connection pool is considered as the root cause of DBC delay.
What is required if the DB connection pool is insufficient? Of course, the solution may differ depending on the user environment. In this document, the required steps are briefly explained through Connection pool resizing and Connection reuse and optimization.
Adjusting the connection pool size
First, you can use the method to adjust the maximum number of connections in the pool. Set the appropriate number of pools by gradually increasing pools and checking that the DB active count is kept within the maximum number of pools. However, if the pool count is set too large, it may adversely affect the application performance due to an excessive increase in resource consumption. After ensuring sufficient memory and capacity, adjust it depending on the operating environment.
Reusing and optimizing the connections
Second, use the method using the connection reuse and optimization. For example, if a connection leak occurs because the application does not return used connections, it cannot be resolved even though you increase the connection pool count. In this case, the DB active count trend draws an upward trend graph. To prevent the connection leaks, you must manage to return the used connections. After using the connection, you can explicitly set to return it or try reusing it.