Exploring the Application Dashboard
This document introduces the analysis of chart-type widgets in Application Dashboard of Application Performance Monitoring (APM), one of the WhaTap monitoring services. Let's look at how to identify and analyze the web application server issues through Application Dashboard. For more information about the functions of Application Dashboard, see the following.
A single web service consists of numerous applications and platforms, so the performance analysis from the application point of view is complicated. Application Dashboard has organized widgets on the dashboard to allow analysis from the following perspectives:
- Application connection status: Agent
- Transaction: Speed Meter, Active Transaction. Active Status, HITMAP
- Service: Apdex, TPS, Average Res. Time
- Resource: System CPU, Heap Memory
- User: Concurrent User
- Comparison on a daily basis: Today's TPS, Today's Visits
Checking the application connection status
On Application Dashboard, you can check the status of the application server connected to the WhaTap monitoring service. If the connected agent is inactive or disconnected from the application server, check inactive items. This makes it easy to see the status of agents.
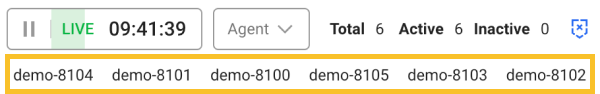
To efficiently use the screen by listing the connected agents in a line, you can try shortening the agent names. For more information of the method how to set the agent name, see the following.
Analyzing the transactions
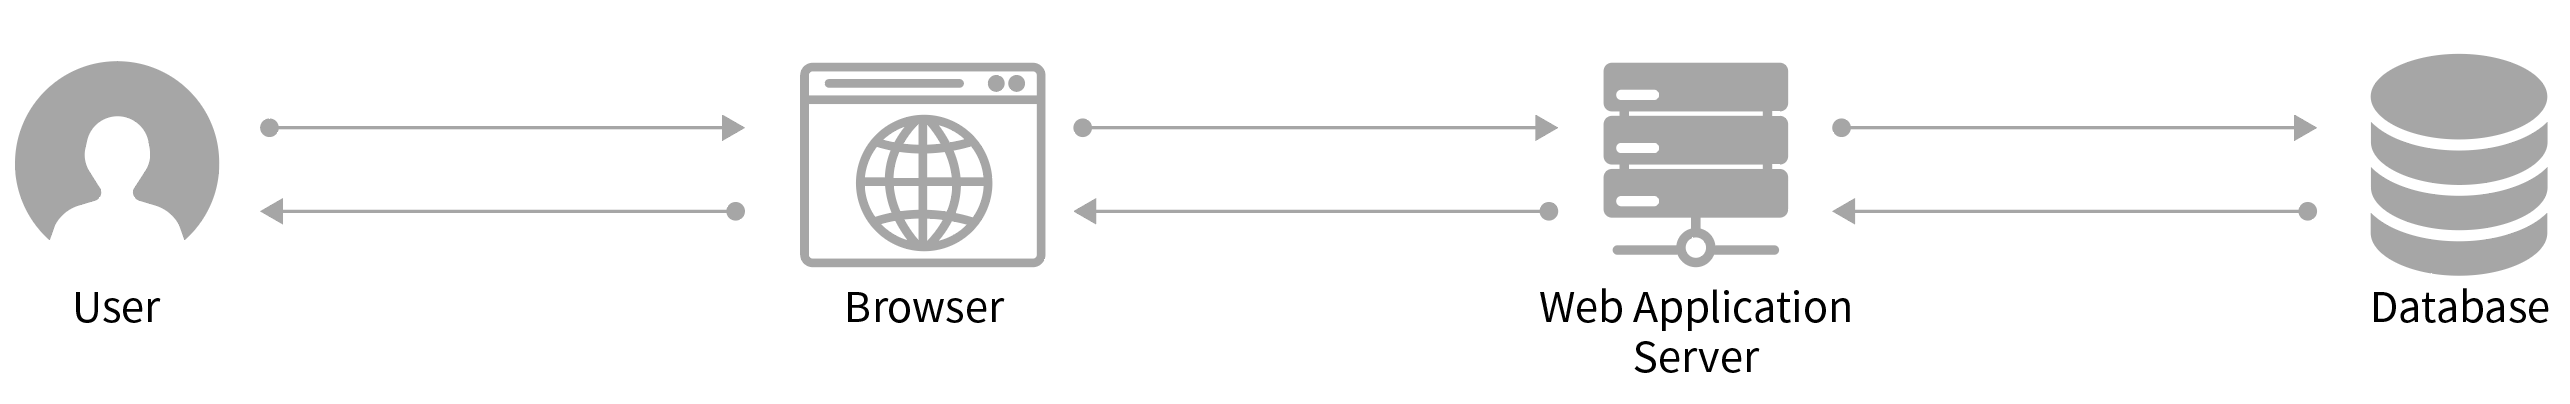
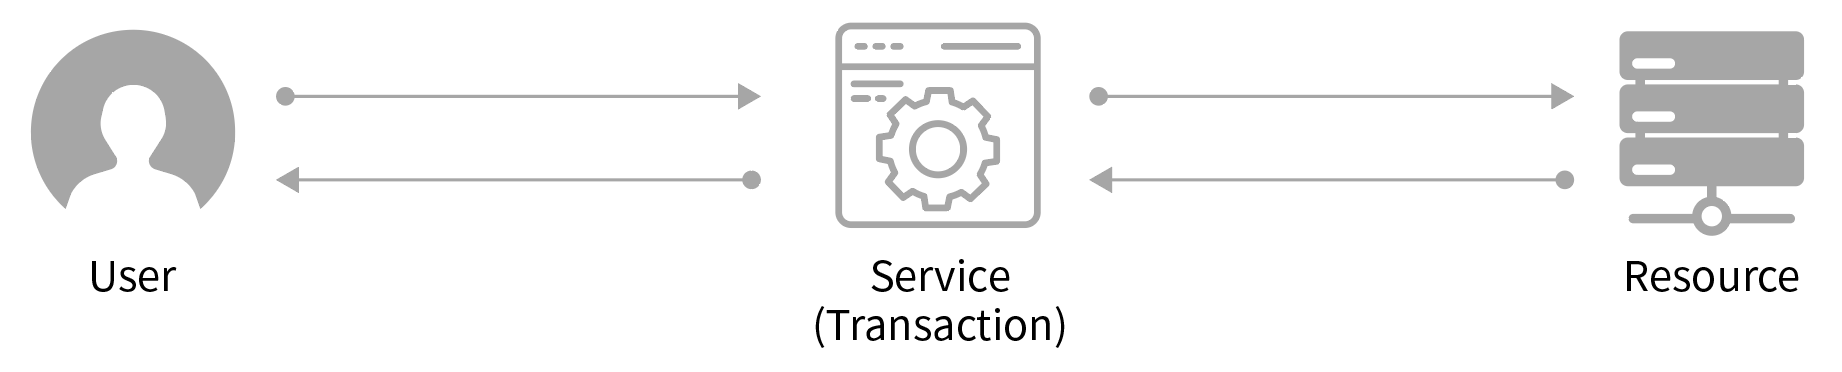
In case of using the web application server (WAS), the service (AP) requested through the browser needs to have normal results. The service (AP) uses the server's resources for operation. The resources include AP processes, OS/HW resources (CPU, memory, disk, etc.), and external systems (Databases and other servers).
If you do not get the desired results or the response is too slow, it is a glitch or a performance issue. This could be a programming issue of the service (AP) or a resource issue. The key to Application Monitoring is to determine whether the cause of the issue is programming, resources, or something else. To catch the cause, you need to verify that any user request has been properly processed. Each user request is called "Request," and the process to handle this request in the server and respond to the request is defined as Transaction.
Transaction refers to the logical unit of work (LUW) on the server side to process requests from each browser. The processing of an individual web service (URL) request is transaction. A transaction in a web application is the process of receiving an HTTP request for the web service and returning a response. WhaTap stores the name of the transaction as a URL. For example, if the browser request URL is https://www.whatap.io/hr/apply.do?name=`kim`, the transaction name is /hr/apply.do.
How fast and error-free the transactions are processed can be interpreted as The service responses are processed without errors. Transactions are divided into "transactions in progress" and "completed transactions." A "transaction in progress" means that a request has been sent but no response has been received, and a "completed transaction" means that a request has been sent to the service and its response has been received. WhaTap's Application Monitoring provides a service that allows you to check the process status of transactions in real time.
Transaction in progress
Transactions in progress allow you to identify the issues that cause delays of 8 seconds or more or that are not widespread and only occur in part of transactions. In the Speed Meter widget located at the top of the next screen, you can check the status of current transactions (center) and completed transactions (right). The active transaction widget displays the transactions in progress by agent out of the entire status. The active status widget expresses the status of the transactions in progress.
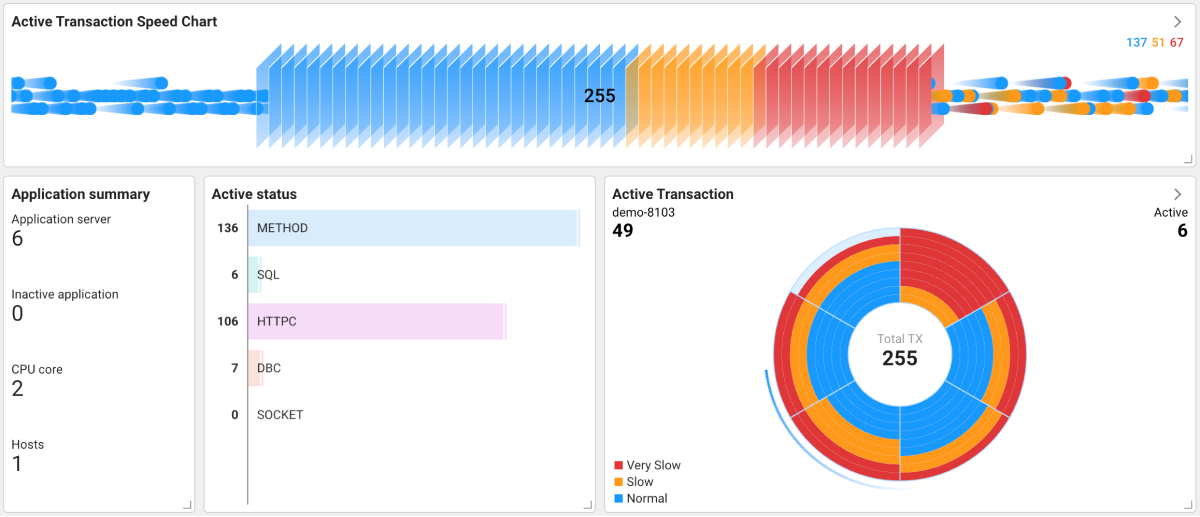
The failure status that can be checked through the transaction, can be recognized through the priority response time. If a transaction in progress does not end, this should be considered a failure. WhaTap divides sections for display by the time of the progress status. Blue color means transactions within the specified response time, orange color means slow transactions with the response time of around 8 seconds, and red color means transactions with the response time that is twice as slow as normal. This allows you to intuitively recognize failures as fast as possible.
In the Active Transaction widget, you can check the status of delays by agent. If the red zones are distributed for each agent, check the factors causing the delay for each application that the agent is installed on. On the contrary, if the red zone appears on only one agent, check the application server. This allows you to immediately determine the location of a failure cause.
External factors can be checked through the Active Status widget. METHOD is considered a normal transaction for other reasons. The other 4 status values help determine the cause of a failure. The items related to external connections are the figures for HTTPC and SQL. As the HTTPC figure goes up, it is considered that the response to the externally connected server does not work. If the connection to the database server is not properly established, the SQL figure increases.
One of the most representative failures in the application servers is the issue for the DB connection pool. If DB connection pools are insufficient, a delay occurs whenever a new connection request occurs, causing the performance failure. In this case, the DBC figure in the Active Status widget increases.
SOCKET indicates the TCP connection attempt to an external system. Likewise, if the SOCKET figure continues to increase, there is a high possibility of failures due to disconnection of the external system.
If transactions in progress have any issues, you can see the stack by clicking the chart in the Active Transactions widget. In the Active Transactions widget, click an agent in the failed area to display the Active Transactions window for the agent. This window lists the transactions in progress. In this list, check whether the Transaction(URL) or SQL/HTTPC(ms) is output identically. You can check whether the cause of the primary failure is the same or something else.
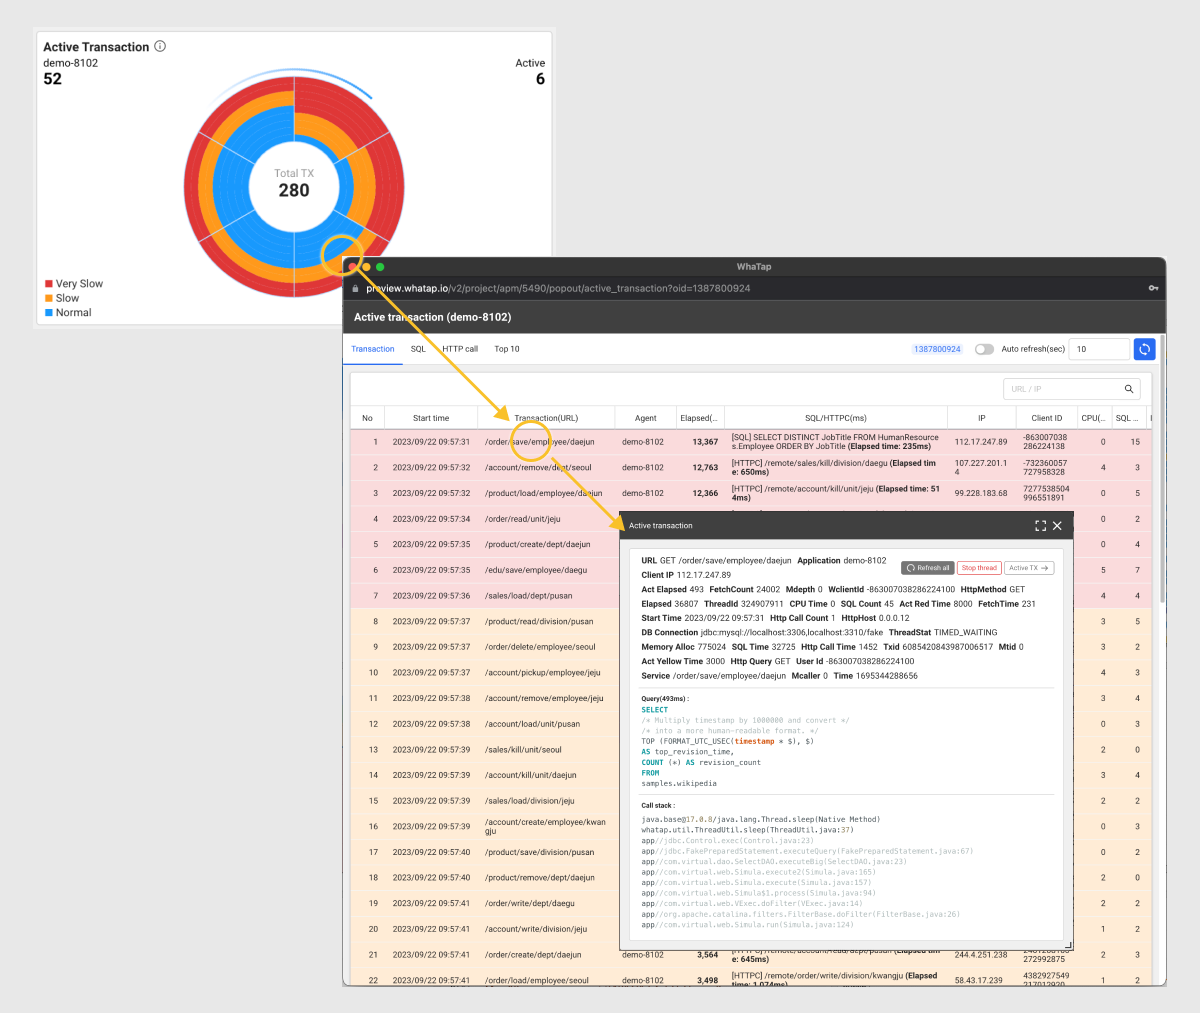
Click an item in the list of transactions in progress to check the stack of the transaction. Using this stack data, the failure cause can be analyzed.
Completed transaction
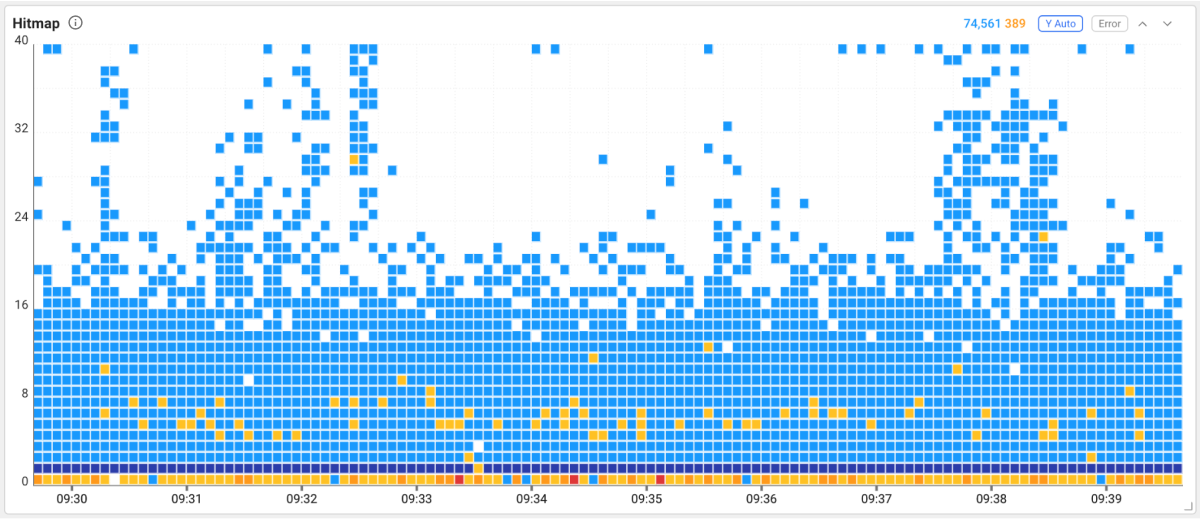
The Hitmap widget allows you to check individual completed transactions on the distribution chart. In the Hitmap widget, if a transaction that should have taken 1 second takes 2 seconds unexpectedly, a transaction that takes more than twice the response time needs to be found to analyze the cause of failure.
You can zoom in or out of the chart by clicking ![]() or
or ![]() on the upper right of the widget. Drag the chart area with the mouse to go to the Trace analysis window.
on the upper right of the widget. Drag the chart area with the mouse to go to the Trace analysis window.
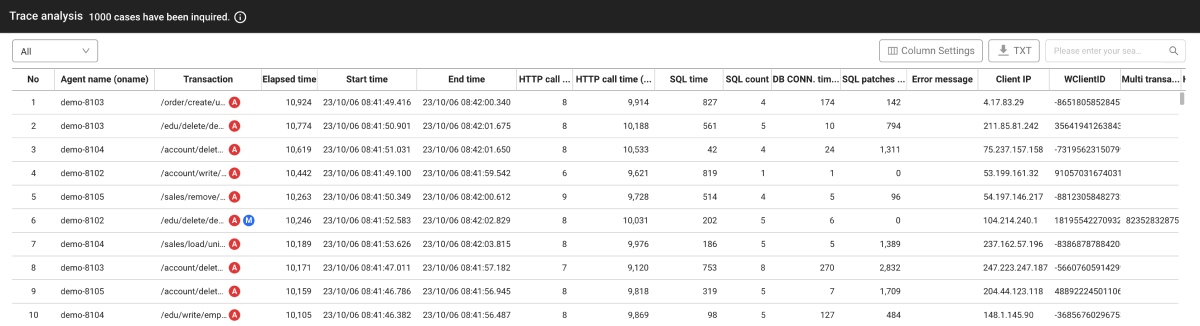
The Trace analysis window displays transactions in the chart area dragged by the user as a list. When you click each item, the transaction details appear on the right. Through the Table view tab on the right of the screen, you can see in which process the transaction has been slowed down step by step.
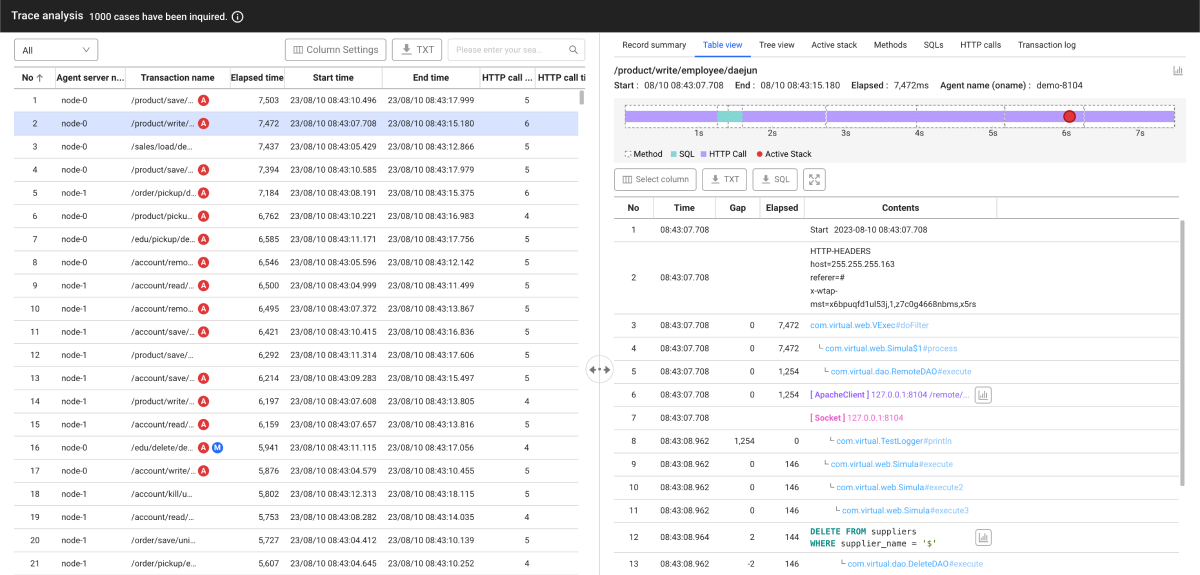
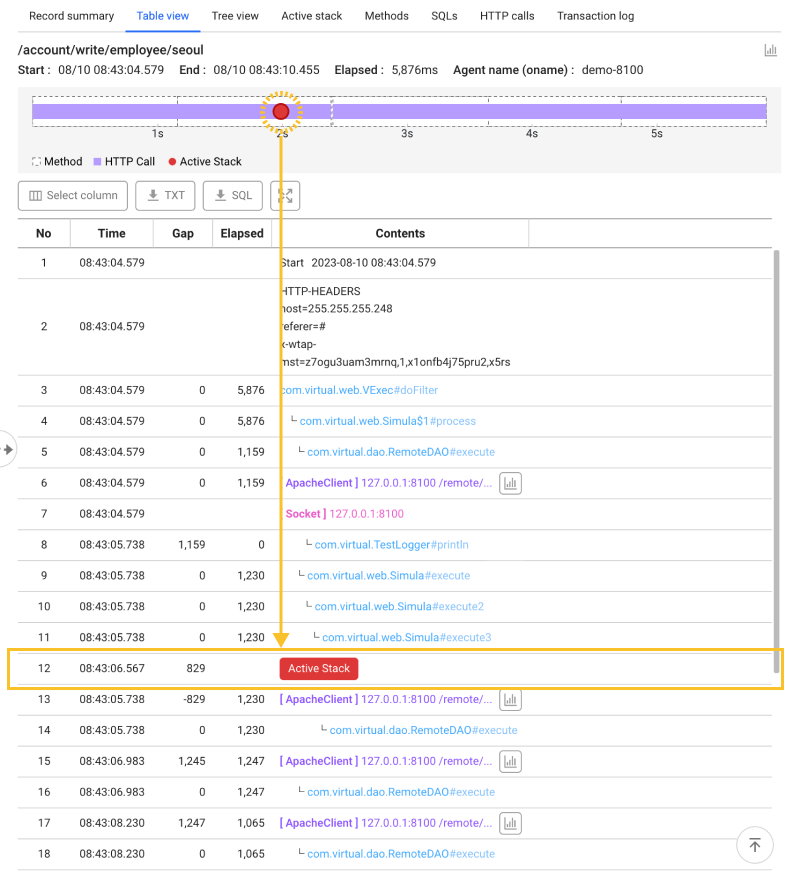
A number of methods are executed until a user request comes to the server, performs logic on the server, and displays the result. Which method should be traced to see where it has slowed down? WhaTap stores multiple user requests as snapshots at default intervals of 10 seconds. Include the stack data stored in snapshots in transactions. At this time, the stack data is defined as Active Stack.
For more information about Trace analysis, see the following.
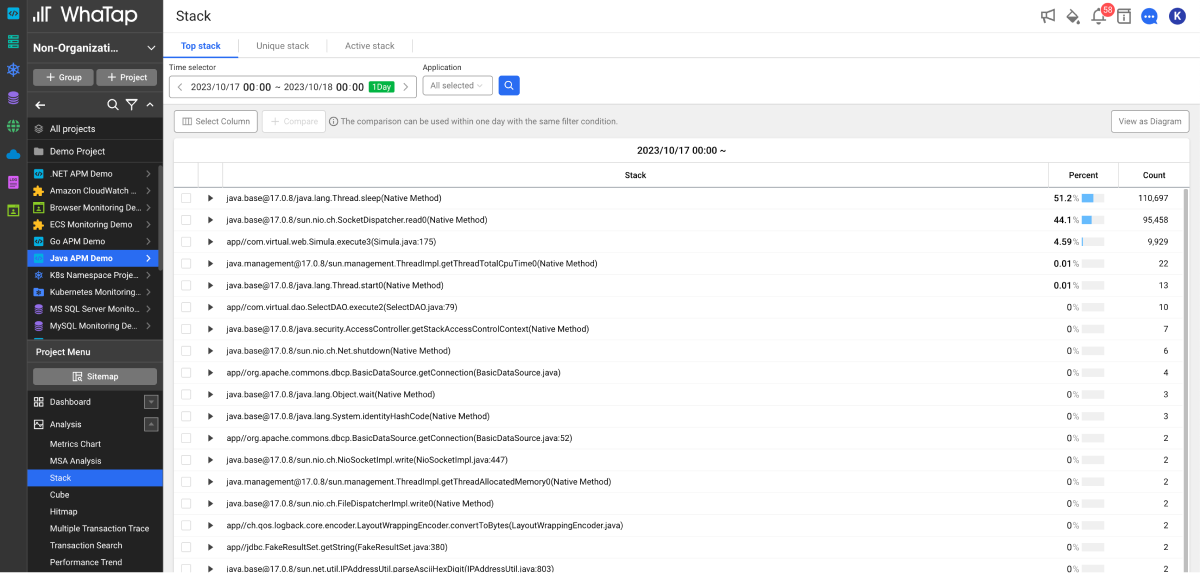
Analysis > Stack is the function that allows you to collect stacks and list them based on the accumulated amount. You can statistically detect the delayed method sections for the internal logic that is not related to resources.
Analyses for users, services, and resources
To perform AP tuning by analyzing the correlation between users, services, and resources, you need to check the TPS, response time, and CPU utilization depending on the user count.
Transaction Per Second (TPS) means the amount of transactions processed per second. As the number of users increases, the TPS is graphed as follows.
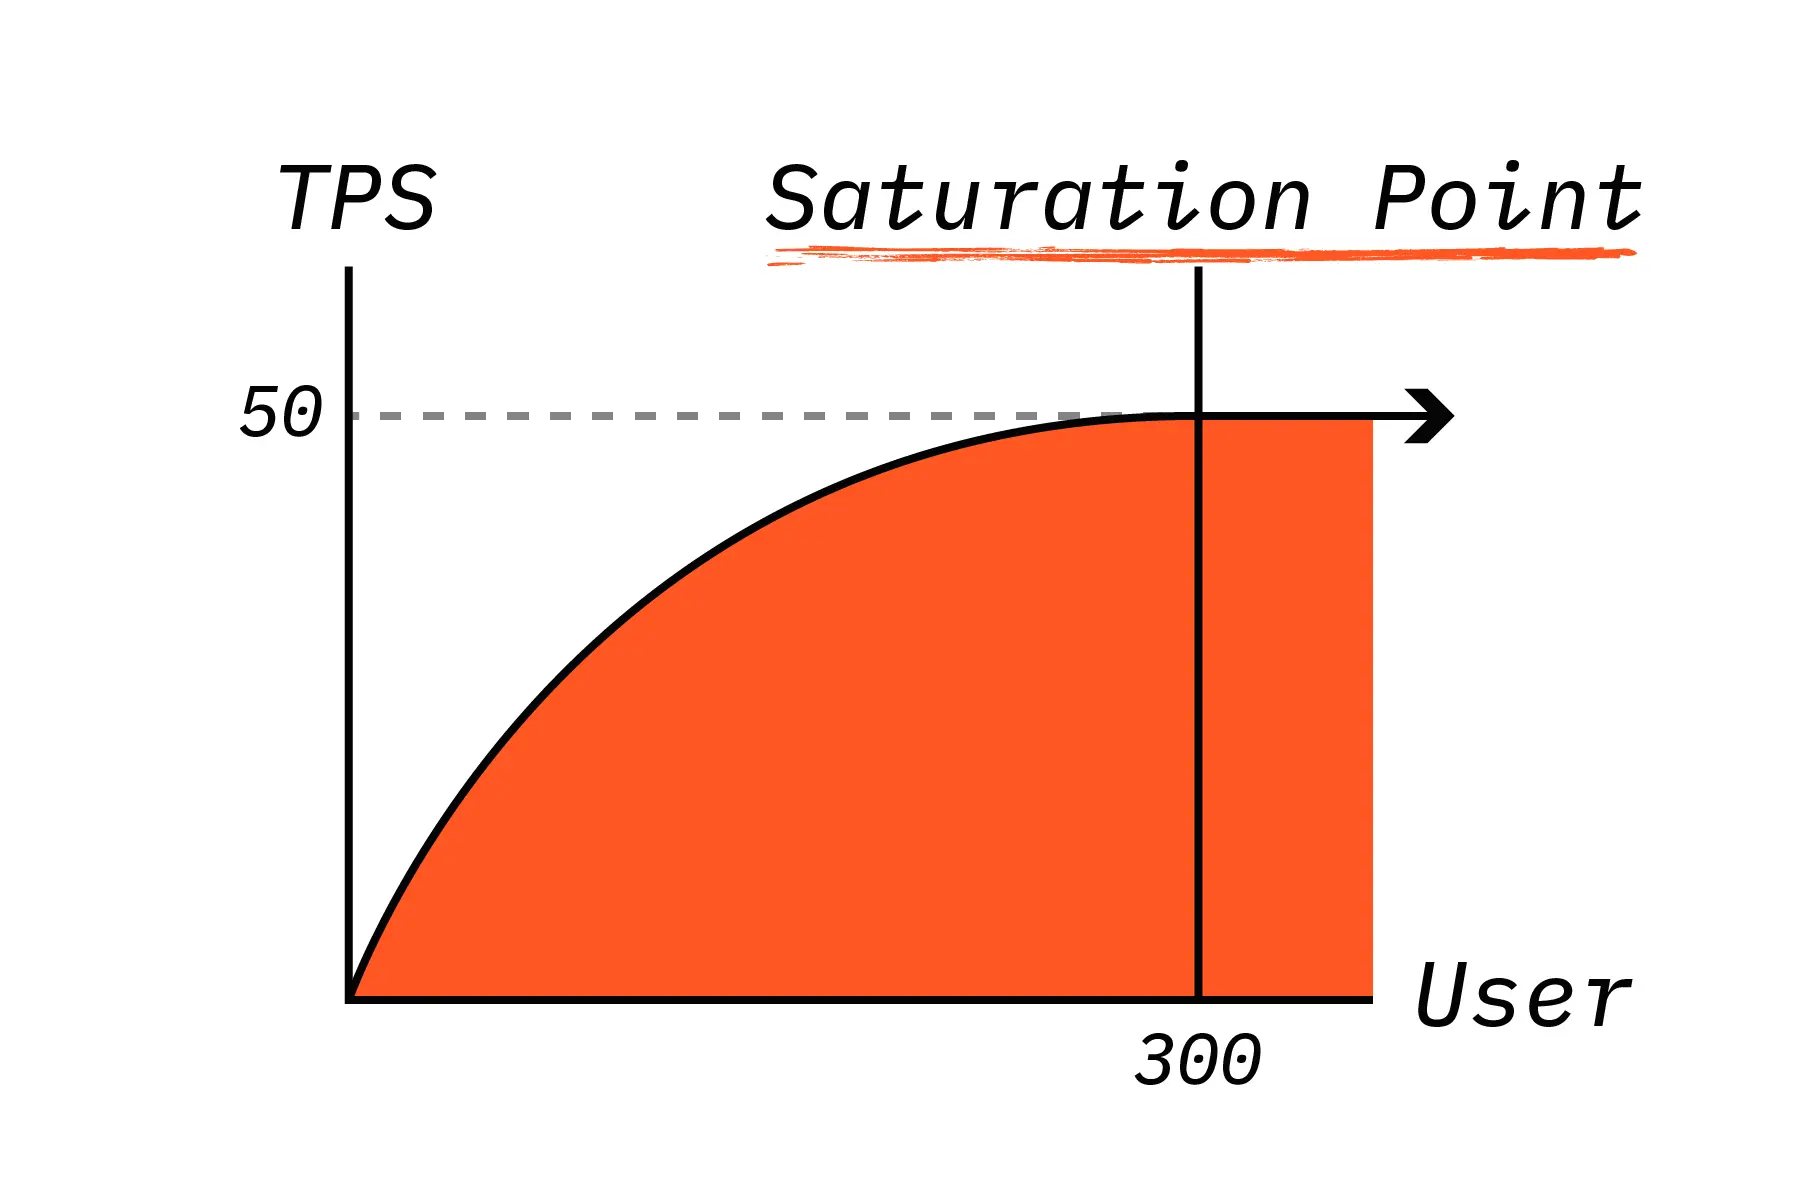
If the users continue to increase for the service, at some point, the situation happens in which TPS does not increase any more. The point at which TPS does not increase is called the Saturation Point. The service like the graph above is an ideal situation. The service that is not properly tuned may experience a drop in TPS.
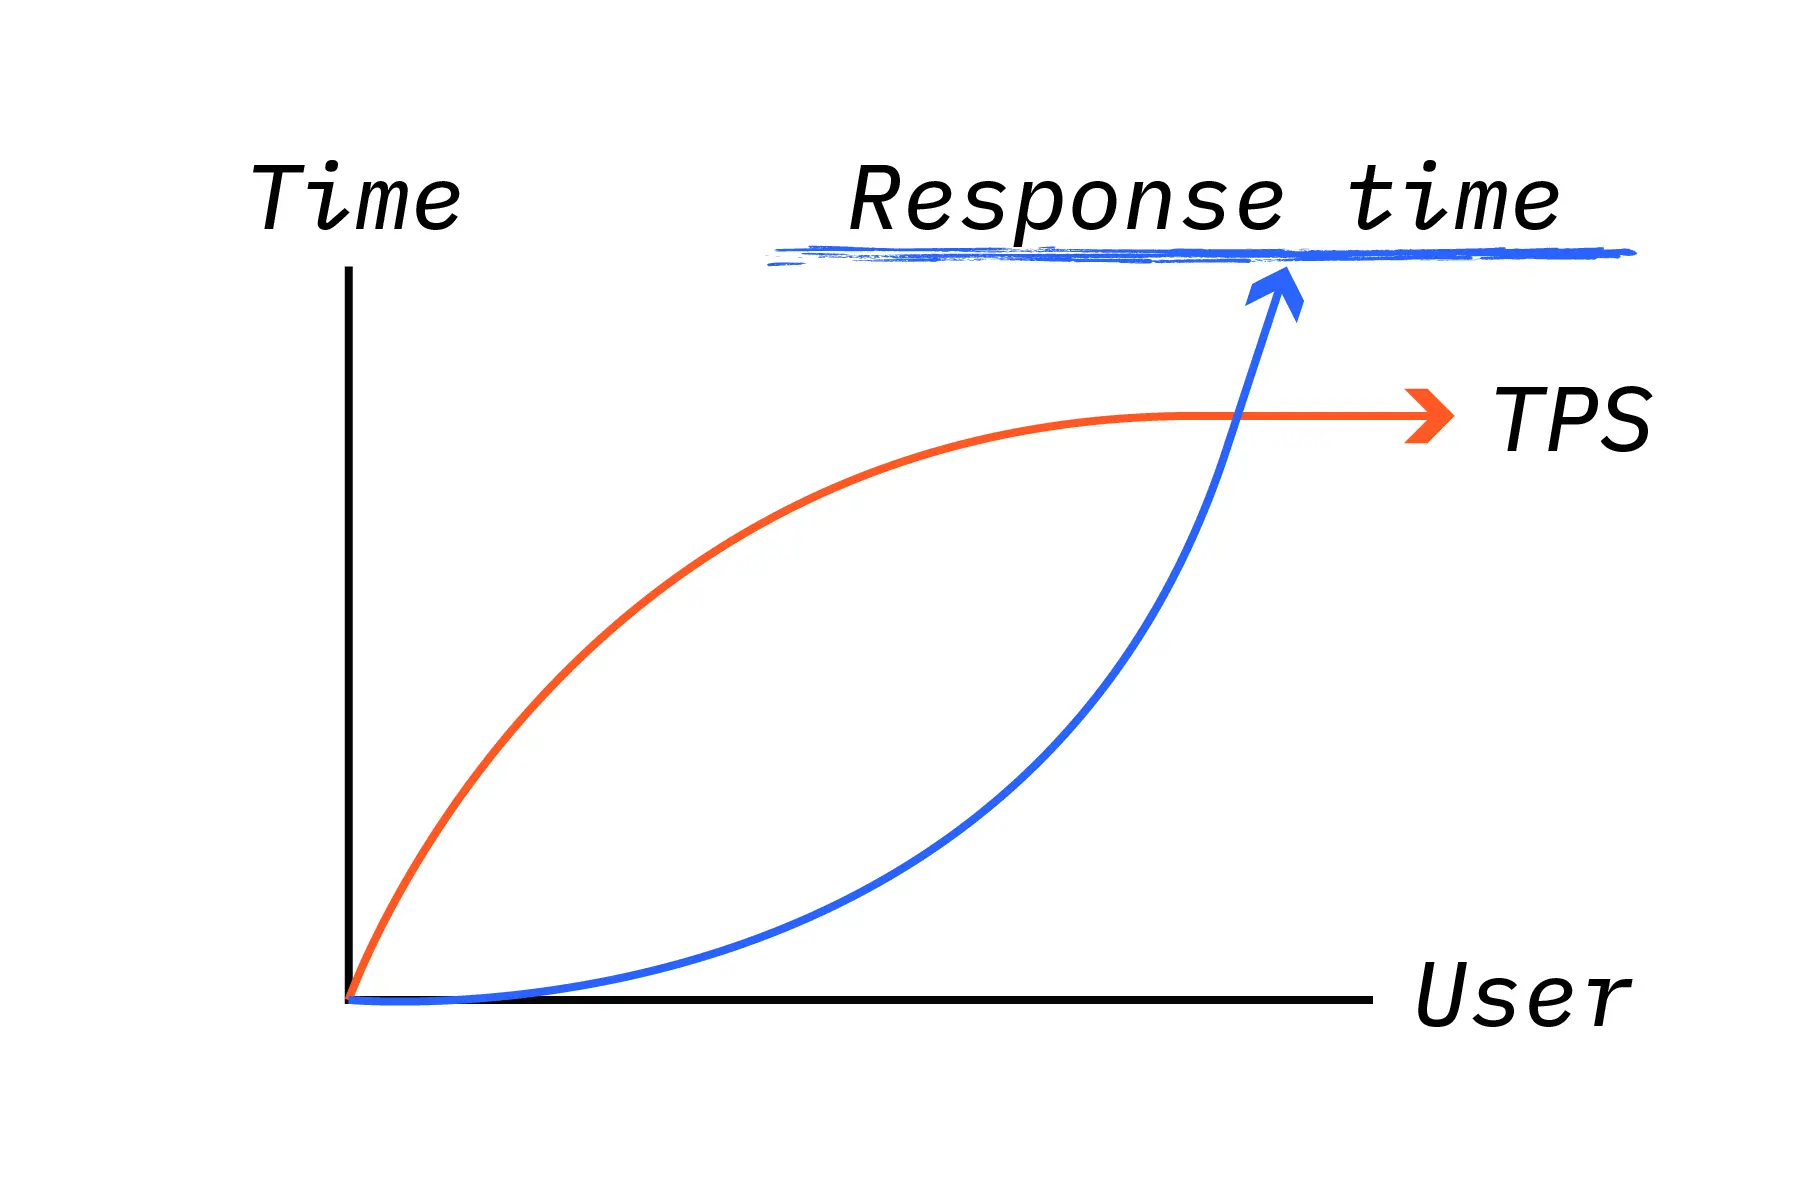
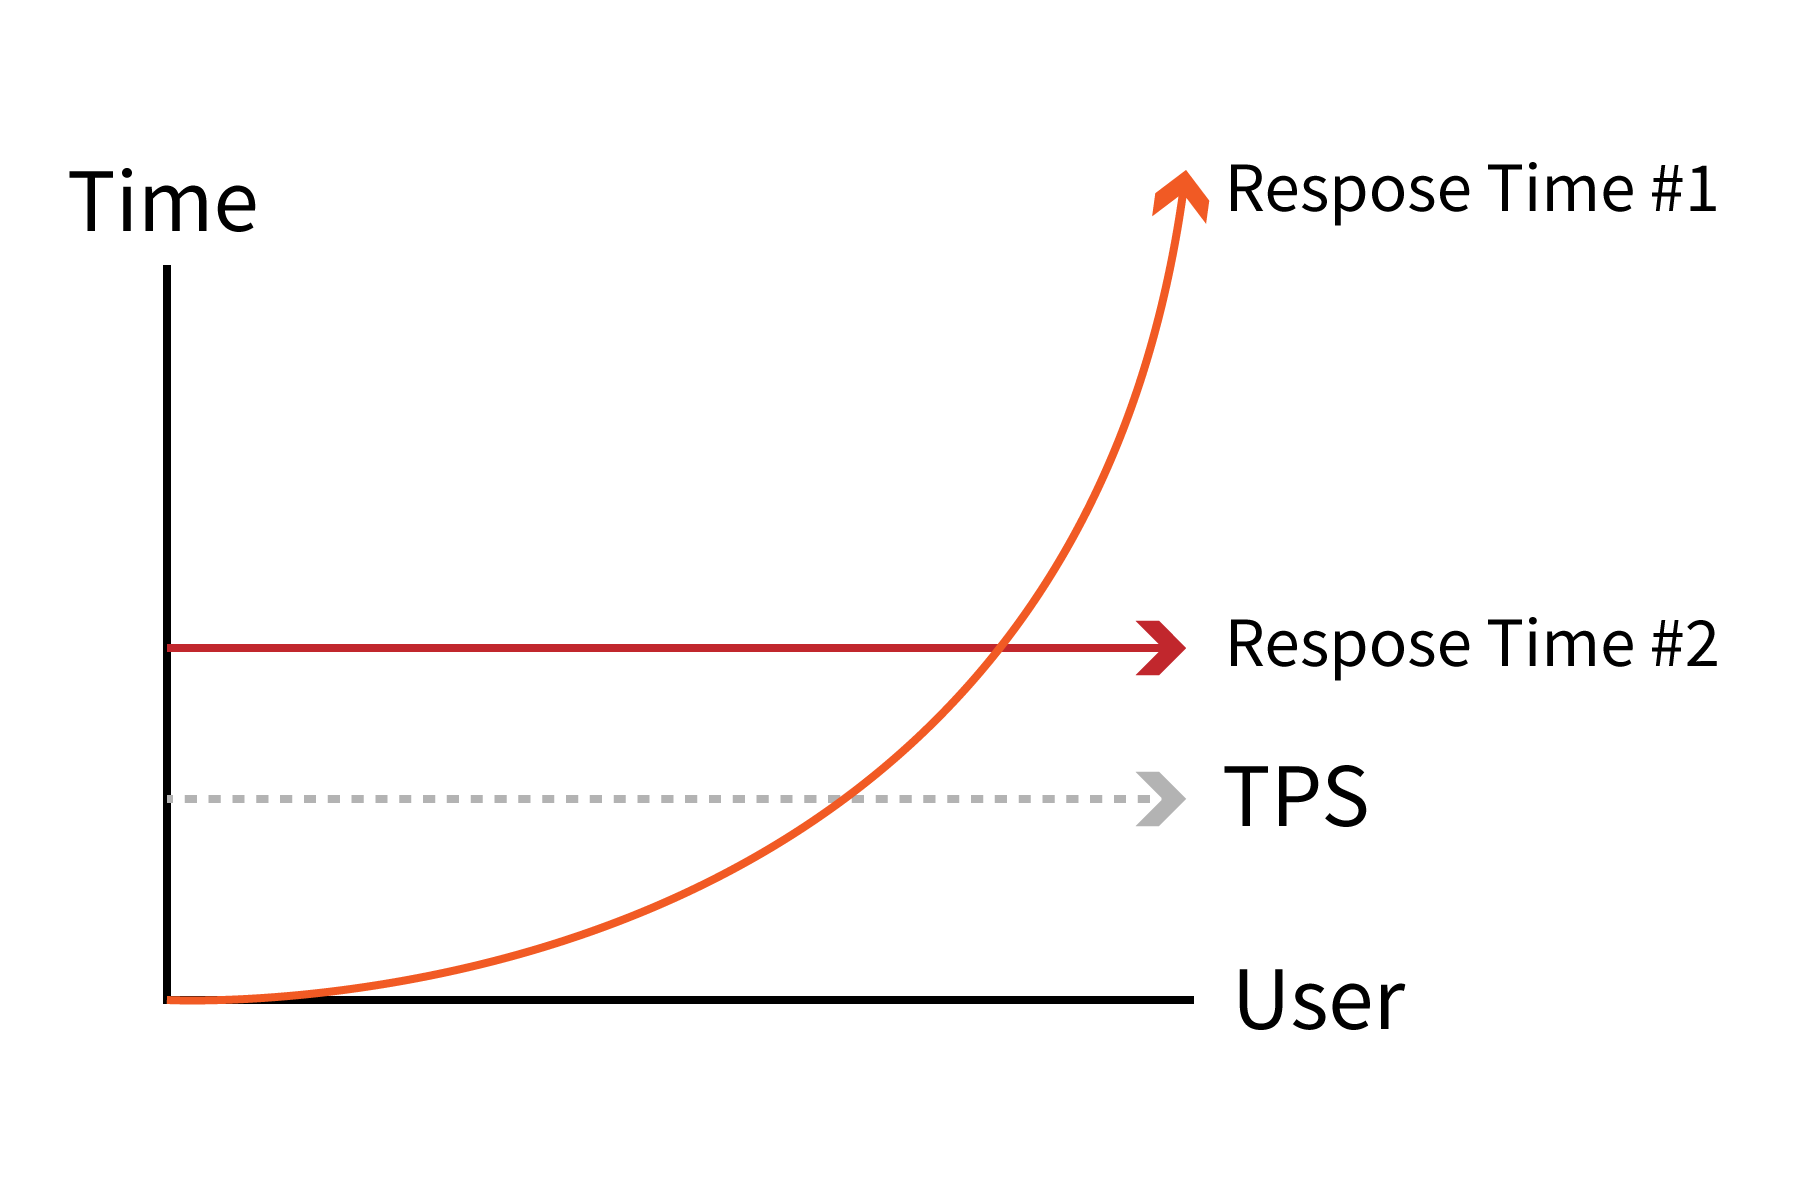
See the following graph. If the users increase while the TPS does not increase any more, the response time increases in proportion to the number of users.
The CPU utilization is plotted as the number of users increases.
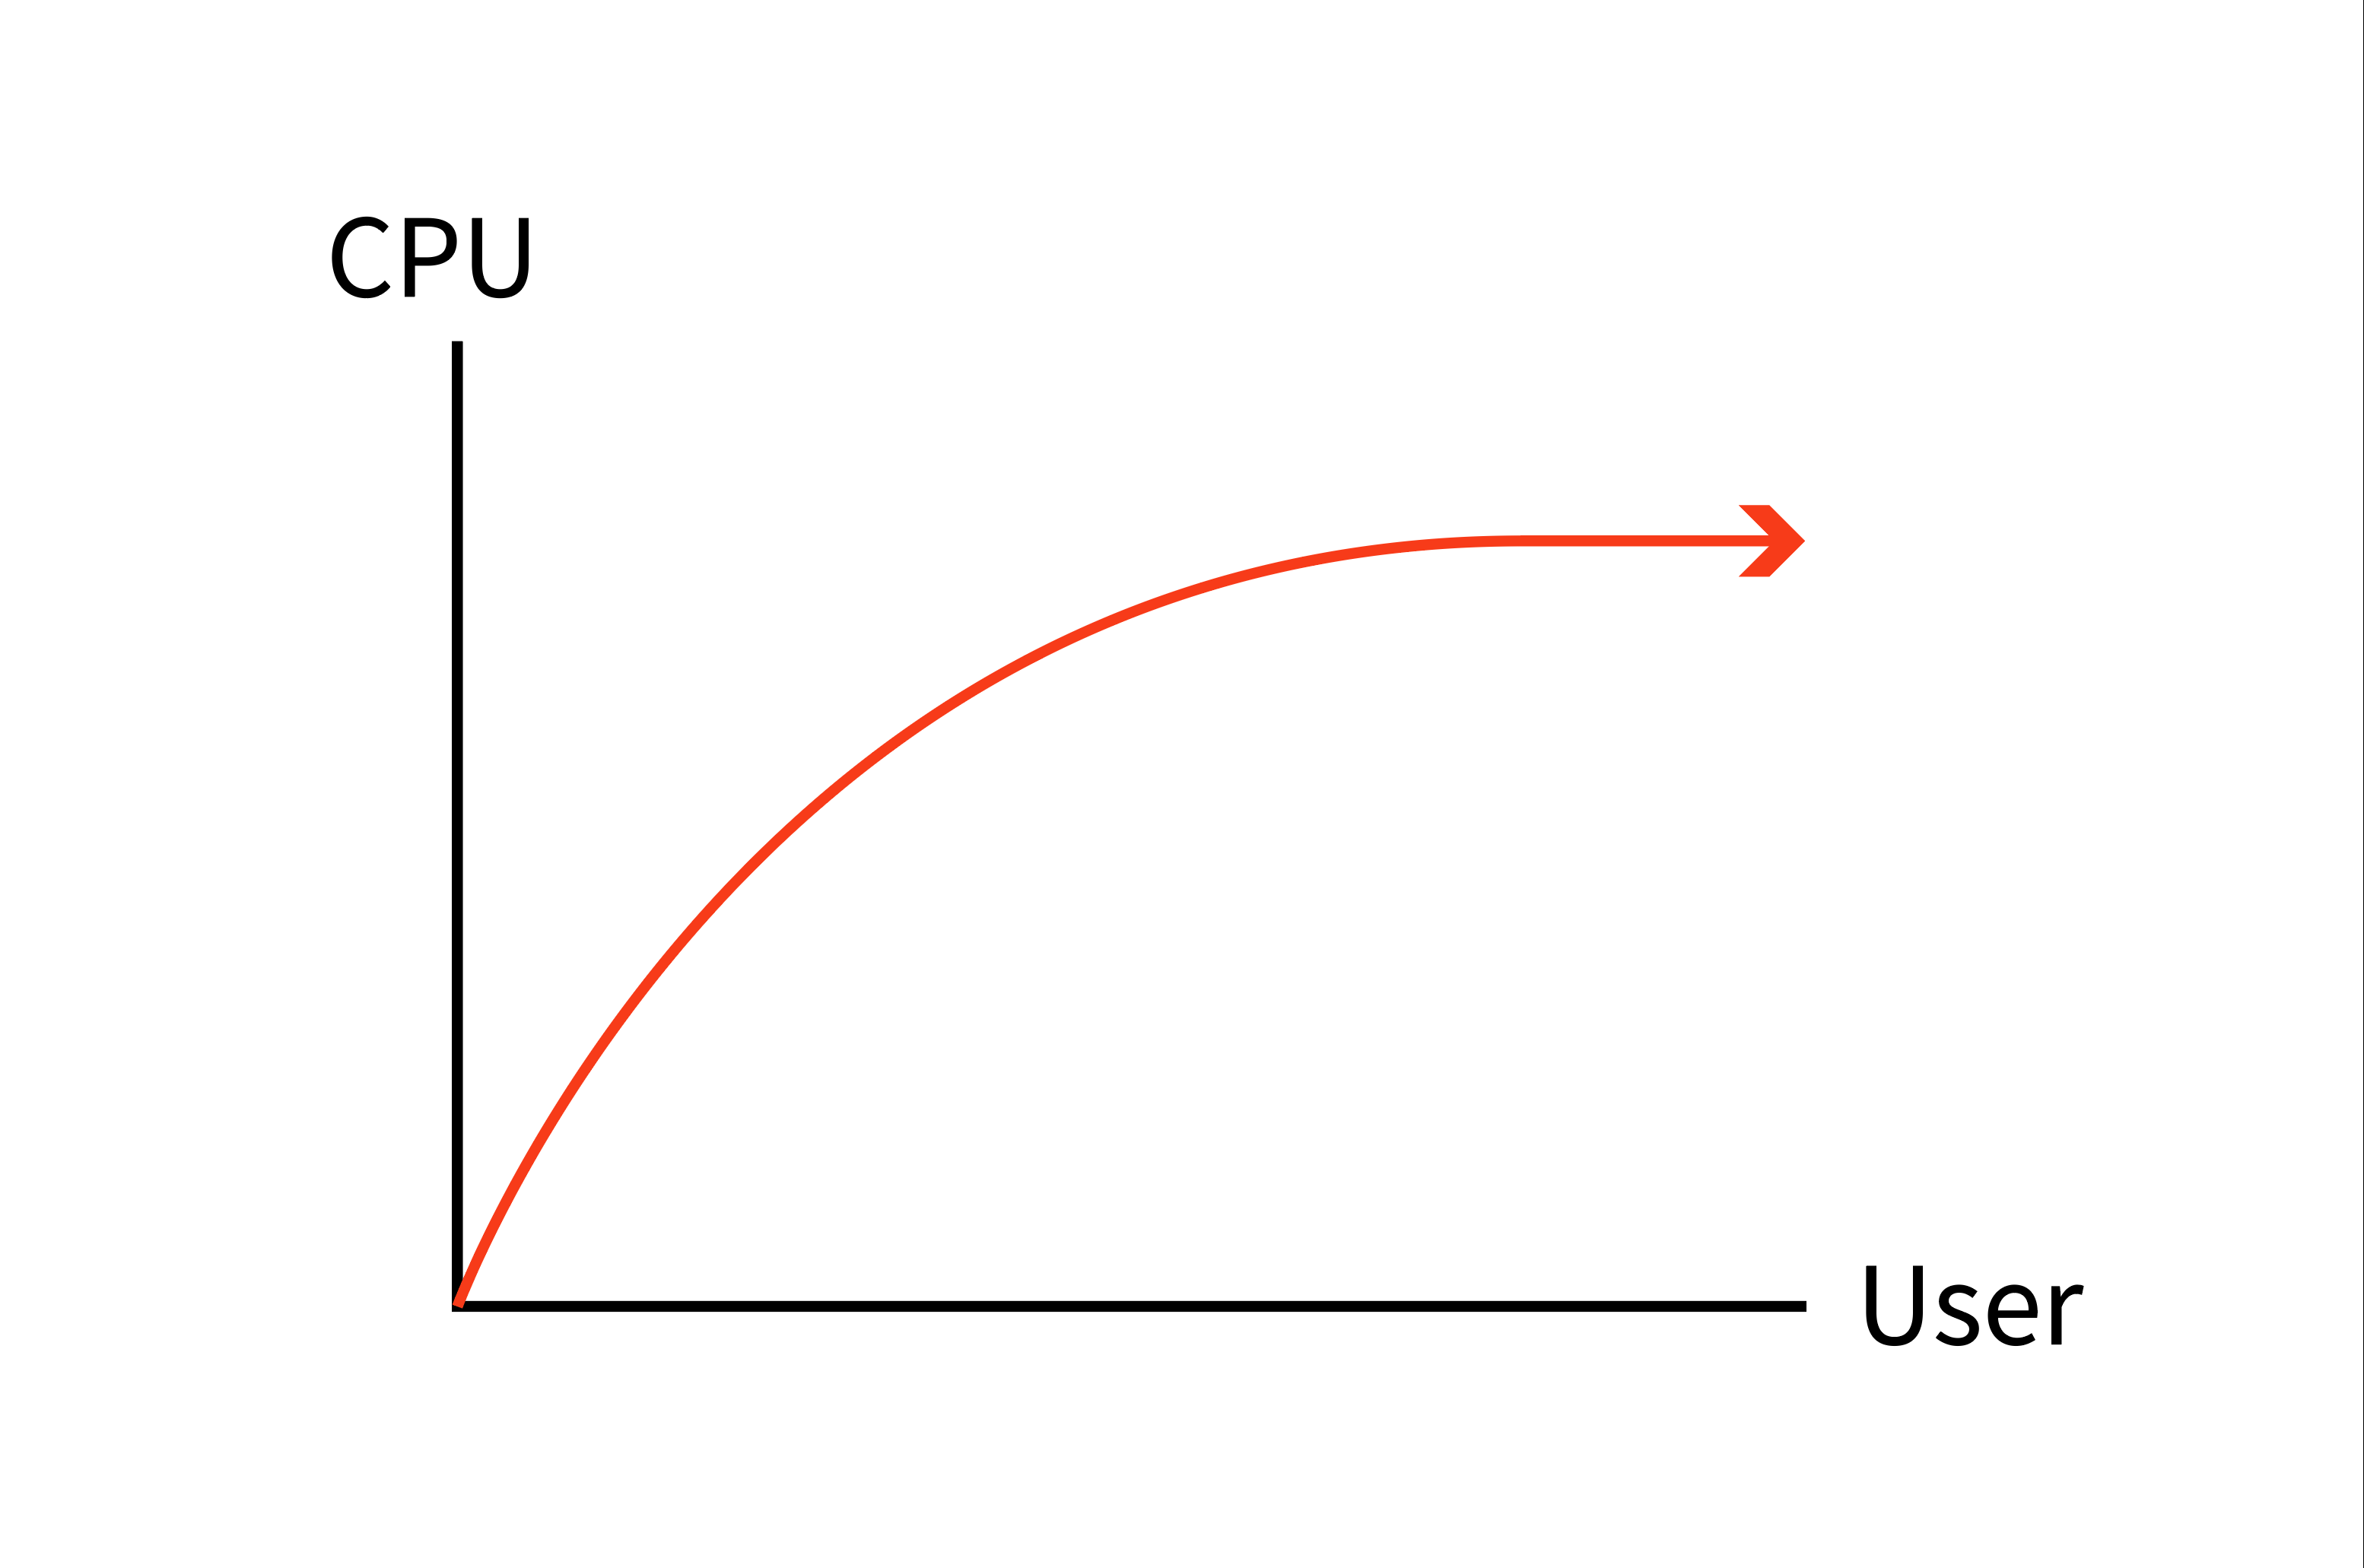
It is hard to know the maximum of TPS, but the maximum value of CPU is 100%. However, even if the CPU utilization is 100% or close to it, it is difficult to determine whether the resources are insufficient based on the CPU utilization alone. This is because there may be a problem with the service logic, causing high CPU utilization. Therefore, it is important to intuitively see and compare the three graphs above.
TPS is a measure of performance. In other words, the maximum TPS indicates the maximum performance of the system. Optimal tuning is to increase the maximum TPS value.
The response time increases proportionally as the number of users increases. Accordingly, it is difficult to use it as a metric for tuning. However, it is important to make the response time graph smooth. To increase the maximum TPS, flatten the graph for the response time. Accordingly, the tuning target is the response time. You have to identify and analyze the response times for individual URLs (e.g. transactions). Using the hitmap, you can analyze the response times of transactions and find the slowdown section to identify the root cause.
With the above concepts in mind, check the TPS widget in Application Dashboard and the Today's Visits or Concurrent User widgets. If the TPS count goes down while the users increase, it indicates that there is more traffic on the server. In this case, it is recommended to increase the server resources through scale-out or to maintain the constant TPS figure by controlling traffic.
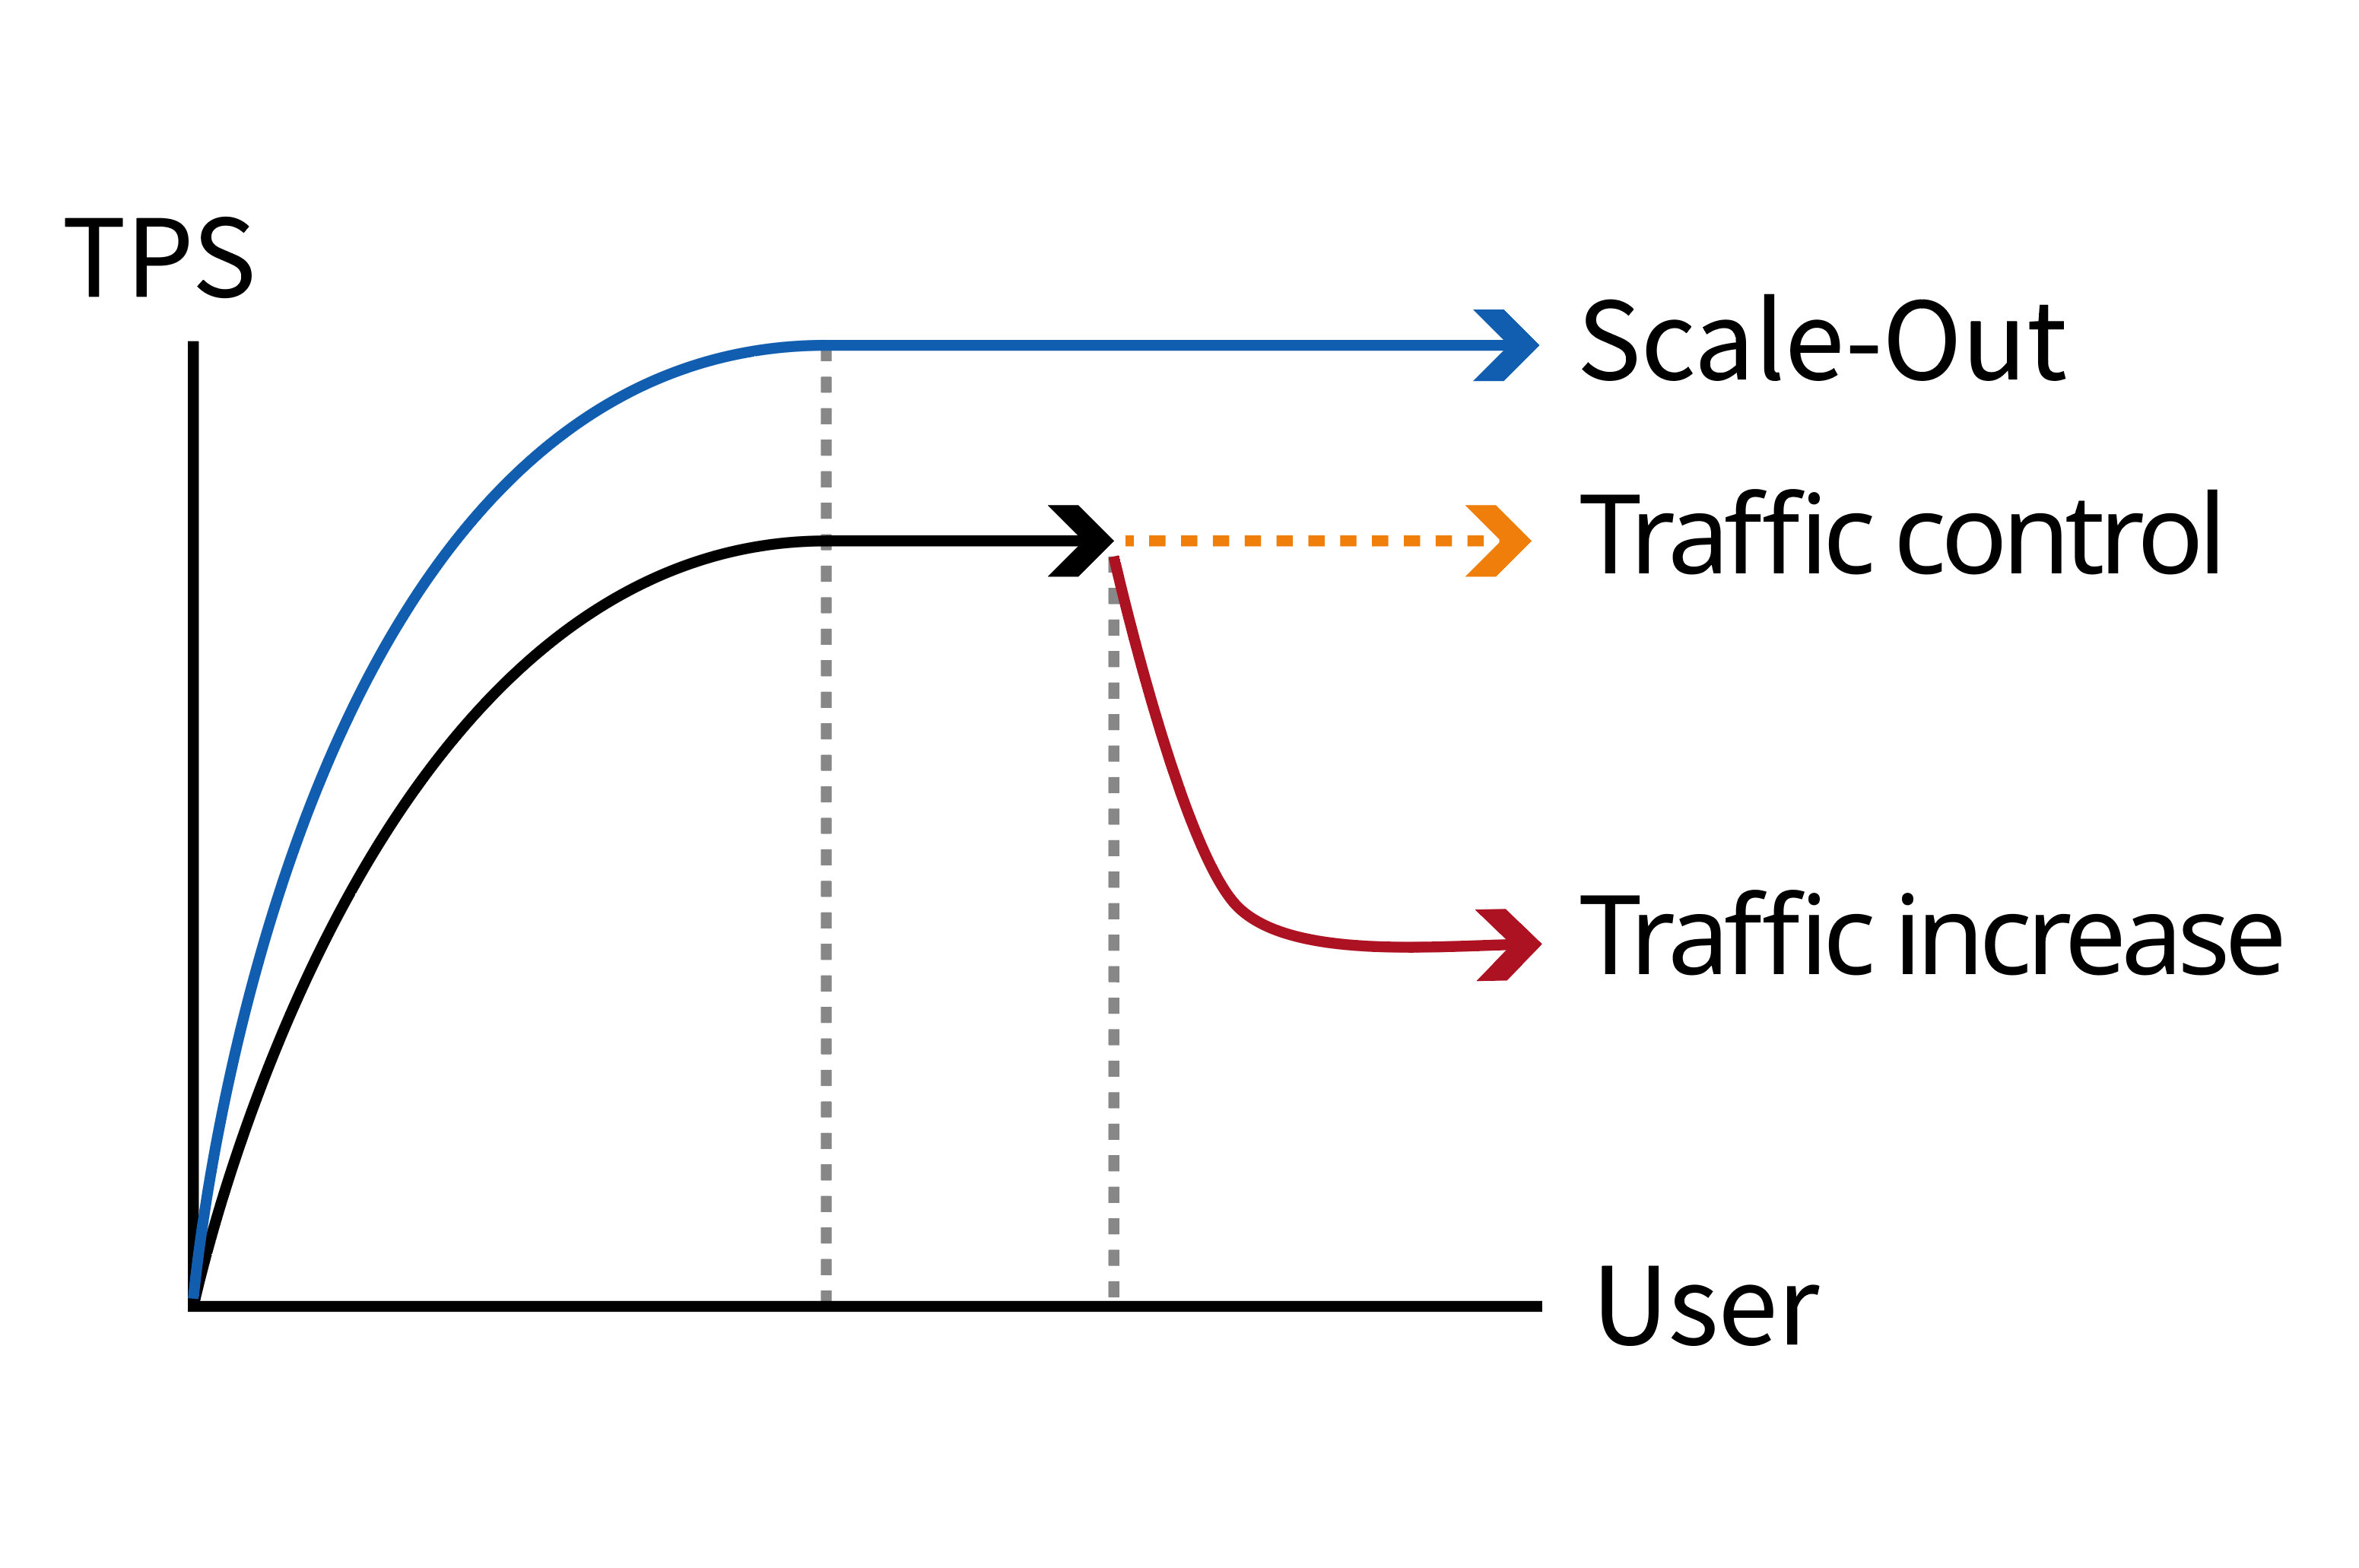
If you perform scale-out, you need to add a WhaTap agent so that monitoring can be done at the same time. If traffic control is required, set the agent to do that. You can enable the throttling that limits the maximum concurrent process count of the application. For detailed settings, see the following.
As shown in the following graph, if the users increase but the TPS figure does not increase to the maximum and remains constant, two situations must be considered. If the response time continues to increase as in the Response #1 graph, there may be a problem with the service logic. On the contrary, if the response time maintains a constant value as shown in the Response #2 graph, the server cannot receive any user request. Check the network status.
In addition to this, you can check the Apdex and Heap Memory widgets to measure the customer satisfaction of your web application.
Application Performance Index (Apdex) is the indicator of the application performance.
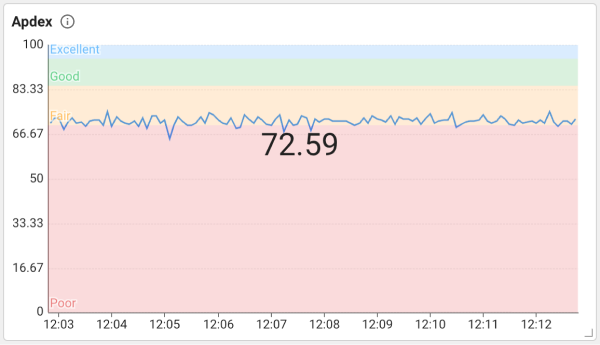
It can be used as a metirc of user satisfaction and it has a value between 0 and 1, 0 to 0.7 is Poor (red), 0.7 to 0.85 is Fair (orange), 0.85 to 0.95 is Good (green), and 0.95 to 1 is Excellent (blue). Apdex metrics and color areas help you determine whether your application is responsive enough for your users. For more information about the Apdex metric, see the following.
The Heap Memory widget displays the maximum available memories for each server and the currently used memory.
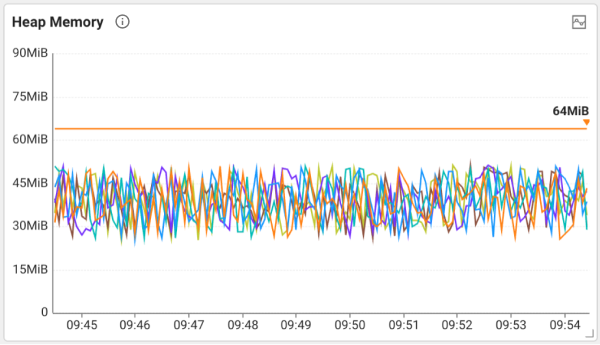
If the heap usage is insufficient, GC occurs frequently and occupies excessive CPU. Normal heap usage patterns go up and down due to GC. For more information about analysis of the heap memory chart, see the following link.
- Monthly WhaTap: Metrics to pay attention to monitoring
- Analysis of Java heap memory chart: Observing the Ch.1 heap chart
- Analysis of JAVA heap memory chart: Analysis of Ch.2 memory leak and heap dump
Increase the efficiency of your monitoring with WhaTap, a highly visible monitoring service that provides an integrated dashboard.