Tablespace Size
Home > Select Project > Stat/Report > Tablespace Size
This menu allows you to monitor and manage the usage status of the database tablespace. This menu provides a visual overview of the total size and usage of the tablespace, and allows you to check the detailed usage history.
-
You can visually check the changes in tablespace size and usage over time.
-
It provides the details on the total size, used amount, and used percentage for each tablespace.
By monitoring the usage of tablespaces in real time, you can check the used amount and manage its appropriate capacity. Trace the tablespaces and segments with high usage and then take measures for capacity management and performance optimization. You can also detect and respond to excessive tablespace usage in advance.
table user(owner) collects segments (table, index) that are not SYSTEM_.
Before use
To collect the tablespace size, it is required to set the agent options.
-
segments Boolean
Default
trueIt collects the segment size information. In Stat/Report > Tablespace Size, you can see the size by selecting the database or tablespace.
-
segments_hour Int
Default
5Set the time to collect the segment size information. The default value is
5and collection starts at 5 am. -
segments_min_size Int
Default
10The minimum unit for collecting segment size information, the default value is 10 MB. When collecting segment sizes, the segment sizes less than the set value are not collected.
Basic screen guide
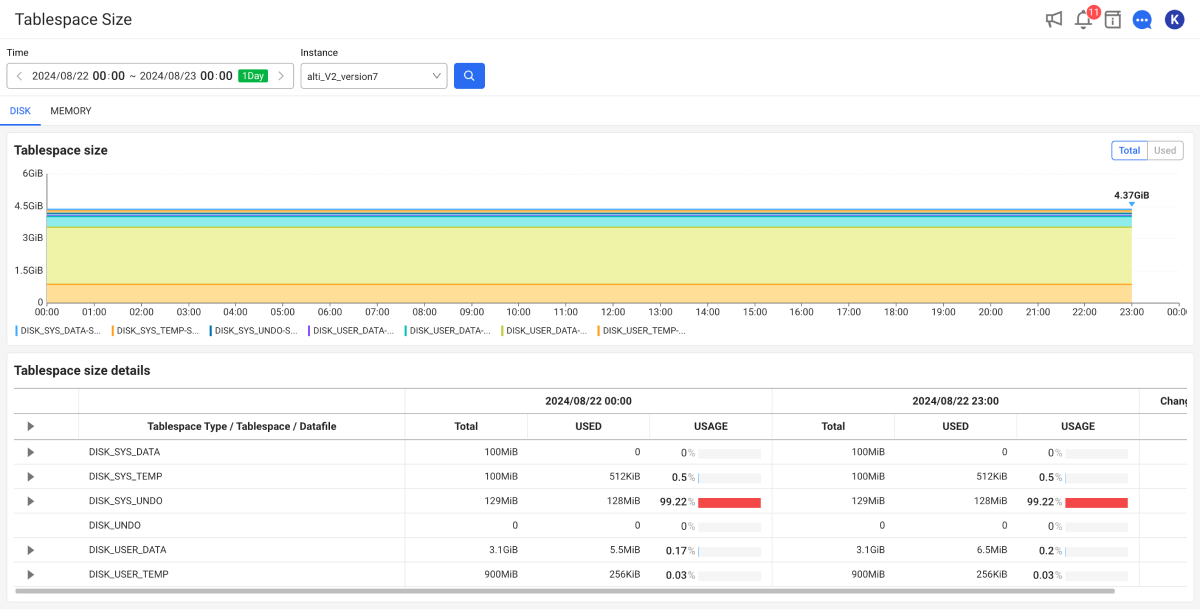
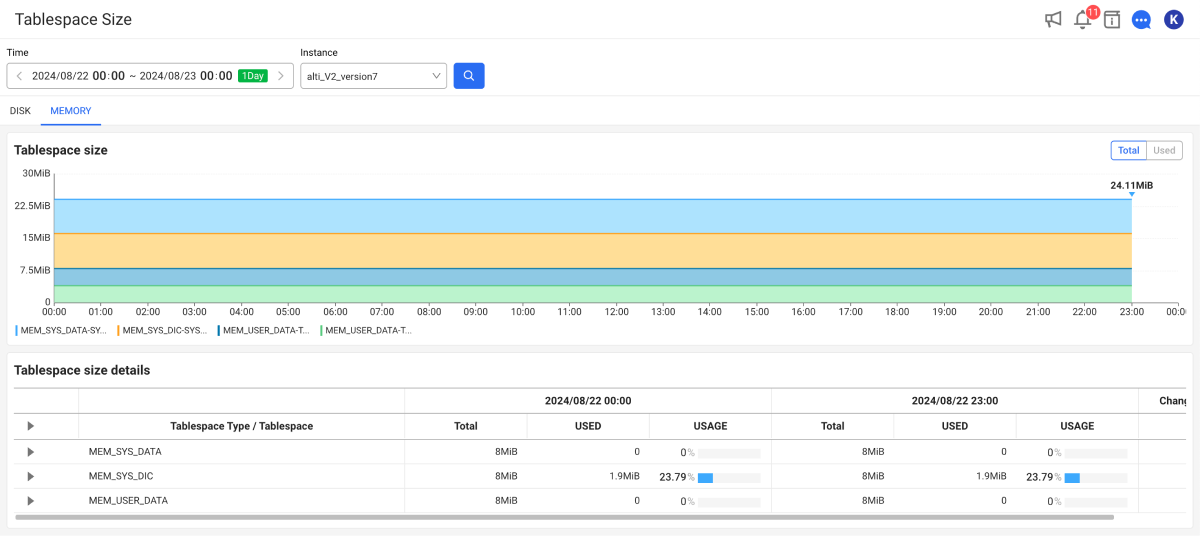
Unlike other DBMS, Altibase Monitoring provides memory tablespaces. In Tablespace Size, you can see the usage and trends of disk and memory tablespaces.
-
Memory tablespaces provide data access speeds that are significantly faster than disk. By monitoring the usage of memory tablespaces, you can check whether data is being loaded properly into memory and memory resources are being used efficiently.
-
Monitoring the usage for both disk and memory tablespaces allows you to understand how each resource is being used. This allows you to balance memory and disk resources and, if necessary, make appropriate adjustments to prevent performance degradation.
-
By analyzing usage trends, you can predict when it will be required to increase memory or disk tablespaces. This helps you prevent performance issues caused by resource exhaustion in advance and establish an appropriate expansion plan.
-
By comparing the usage between memory tablespaces and disk tablespaces, you can optimize load balancing to prevent specific workloads from being overly concentrated on either disk or memory.
-
Disk tablespace
-
Memory tablespace
The basic usage is as follows:
-
In Time, set the period to be analyzed.
-
In Instance, select an instance of the database to be analyzed.
-
Select
 .
.
- The search period can be set up to 3 weeks. If you search for more than 3 days, the graph displays the daily average.
Checking the changes in tablespace size
In the Tablespace size section, you can visually see the overall size and usage of the tablespaces over time.

Each color represents an individual tablespace. To see data for a specific period on the chart, hover your mouse over the chart and move it. A pop-up appears with detailed information for the period.
Tablespace size details
The Tablespace size details section provides information details for each tablespace.
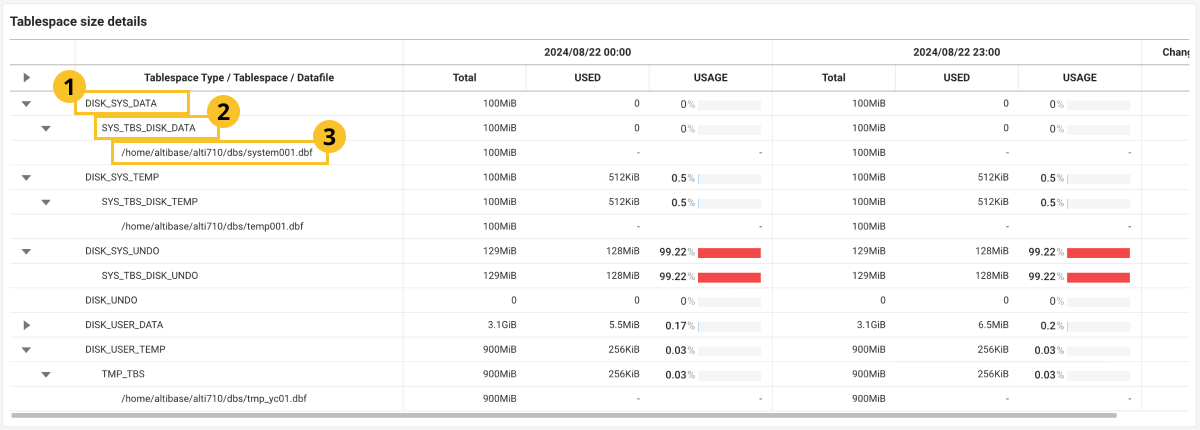
You can check the usage change of each tablespace by comparing the initial query time with the current time. To view the details of a tablespace, select the  button next to the tablespace name. The tablespace and data file size provided by Altibase includes various values such as
 MAX, ALLOC, CURR, and USED. The values displayed on the screen are composed based on these items.
 TABLESPACE TYPE
You can check the size of tablespaces by V$TABLESPACES.TYPE such as DISK, MEMORY, TEMP, and UNDO.
-
TOTAL: Sum of the
TOTALsizes of the tablespaces. -
USED: Sum of the
USEDsizes of the tablespaces. -
USAGE: Usage percentage calculated as (
USED/TOTAL) 🞨 100.
 TABLESPACE
A tablespace consists of multiple data files.
-
TOTAL: Sum of the
TOTALsizes of the data files (V$DATAFILES.CURRSIZE🞨PAGESIZE). -
USED: Used size calculated based on
X$SEGMENT.TOTAL_USED_SIZE. -
USAGE: Usage percentage calculated as (
USED/TOTAL) 🞨 100.
 DATAFILE
TOTAL: Sum of the TOTAL sizes of the data files (V$DATAFILES.CURRSIZE 🞨 PAGESIZE).
Altibase does not provide USED and USAGE at the data file level.
Checking the segment size
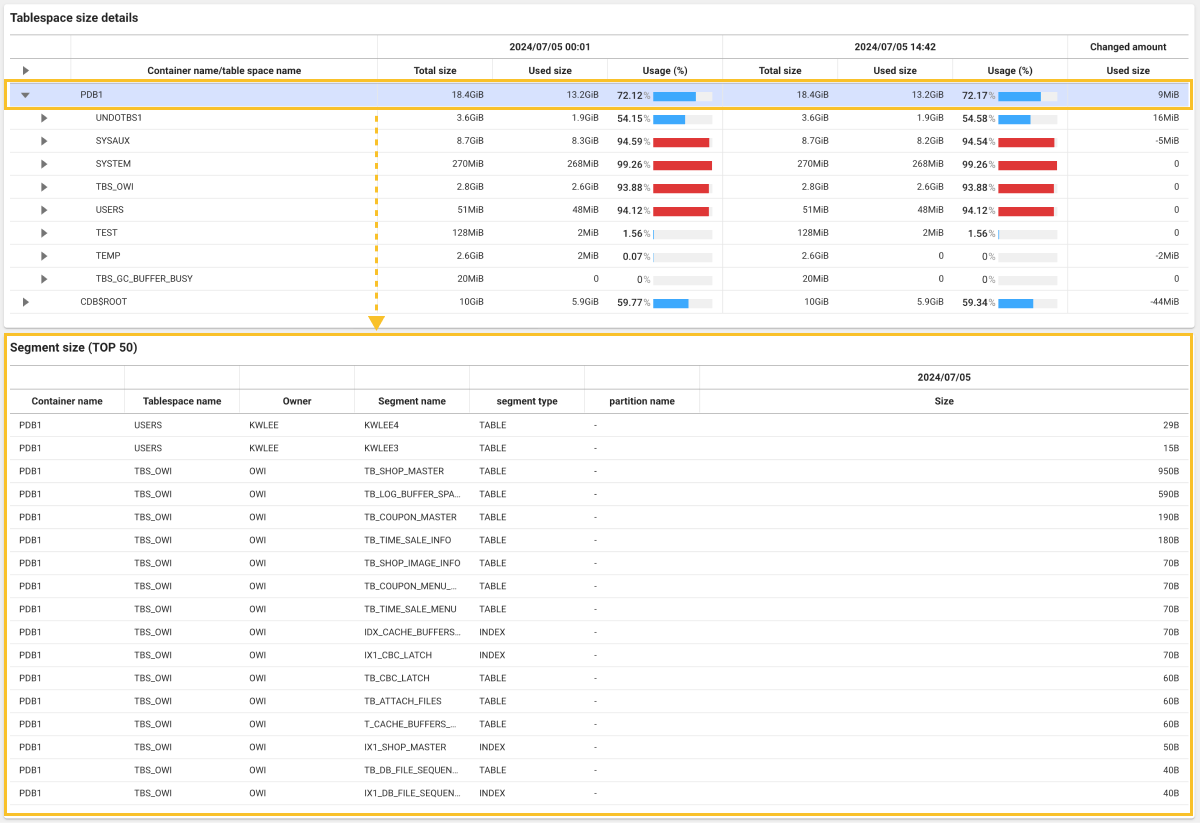
Segment size (TOP 50) provides information on the top 50 segments that occupy the most space within the section tablespace. This information allows users to see how much space a specific segment is using. Each segment is detailed based on various properties. This information can be used to find abnormally large segments and perform space optimization if necessary.
-
Tablespace Type: Type of tablespace.
-
Tablespace: Name of the tablespace to which the segment belongs. A tablespace is a logical space in the database where data is stored.
-
Table: Name of the table to which the segment belongs. This helps you identify which table is occupying the space.
-
User: Name of the database user account that owns the segment. This allows you to find which user manages the data.
-
Segment Type: Type of segment.
-
Partition: For partitioned tables or indexes, this indicates which partition the segment belongs to. Partitioning is a method to manage large tables by dividing them into smaller units.
-
mbytes: Amount of space in megabytes (MB) that the segment occupies. This allows you to see how much physical storage space each segment is using.