Checking the statistical data
SQL Statistics
Home > Select Project > Stat/Report > SQL statistics
It provides the statistical data for each DB. With the time series charts for each SQL, you can see the occurrence time and performance.
For more information about SQL statistics, see the following video clip.
This statistics page is provided based on the session data collected every 5 seconds and the SQL texts. There may be errors depending on the collection method.

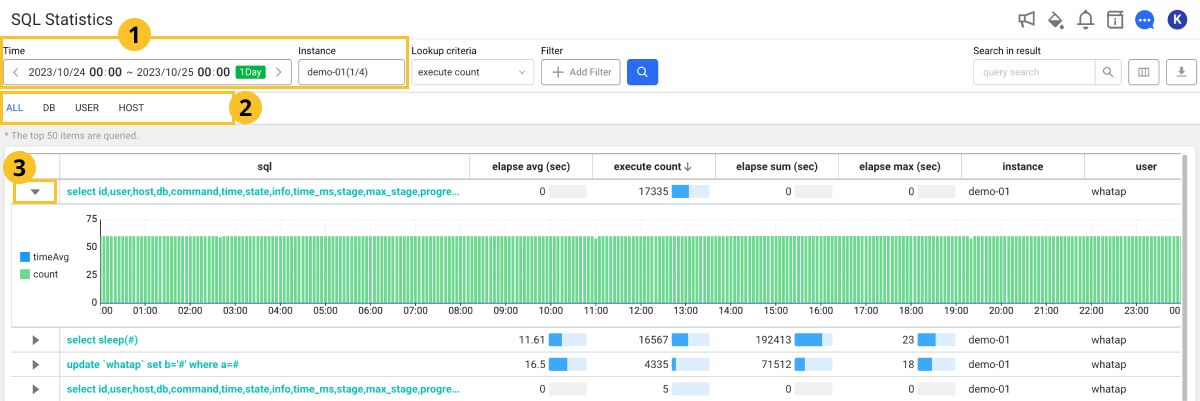
Set the Time and Instance and then select
. To classify and view data by usage category, select the desired tab from
.
Query-based execution trend
On the utmost left for each item of the table, select ►. A chart appears that displays the number of executions every 5 minutes and the average execution time of the query statement.
Previewing the query

You can preview the query statement by moving the mouse pointer to the sql column in the search results list.
See details
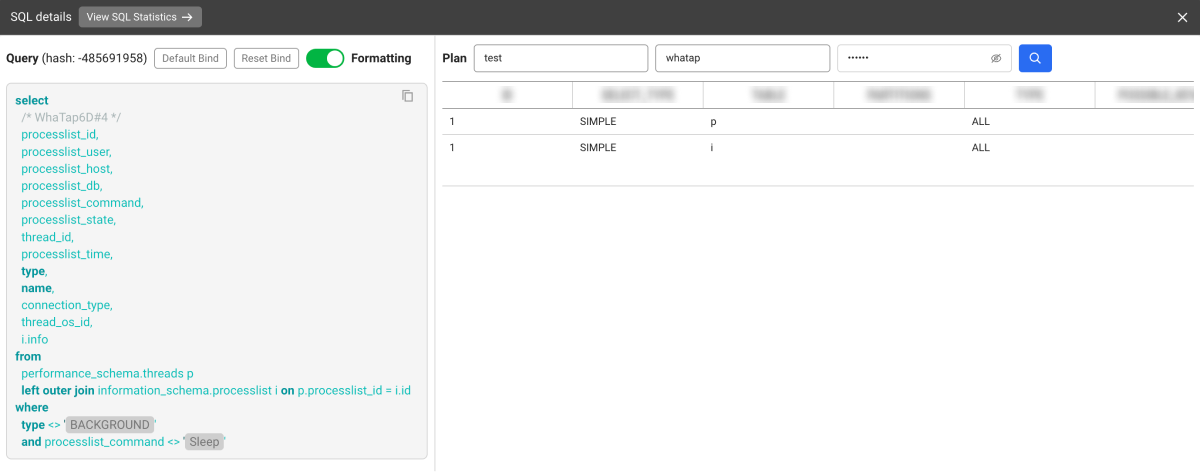
If you select sql from the searched result list, the SQL details window appears.

-
View SQL Statistics: You can go to the SQL statistics menu where you can check statistical information related to the SQL query statement.
-
Default Bind: You can bind the part set as a variable in the query sentence to the default value.
-
Reset Bind: You can release the bound default value and check the variable.
-
Formatting: You can improve readability by applying indentation and formatting to a SQL query statement.
-
Plan: To check plan information, enter DB Name, User Name, and Password, and then select
.
-
If you select
on the upper right of the screen, the Query and Plan sections are placed left to right.
-
If you select
on the upper right of the screen, the Query and Plan sections are placed up to down.