Monitoring a Database Instance
Home > Select Project > Dashboard > Instance Monitoring

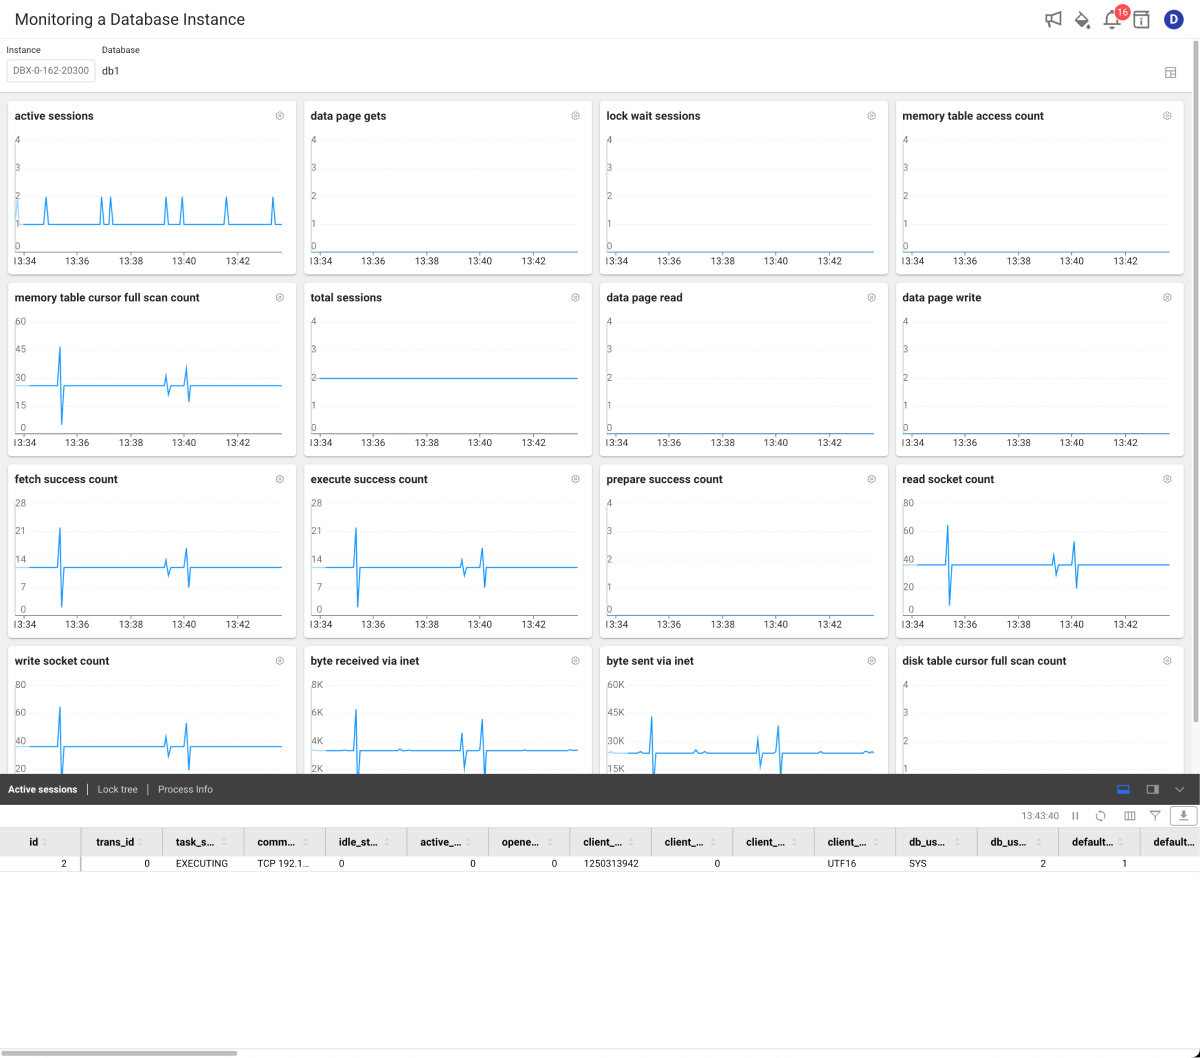
In Instance Monitoring, you can monitor the key metrics of the database server, information details on active sessions, lock tree, PQ tree, and process information in real time. You can also see the alerts that could be problematic warnings.
Using the metrics chart area
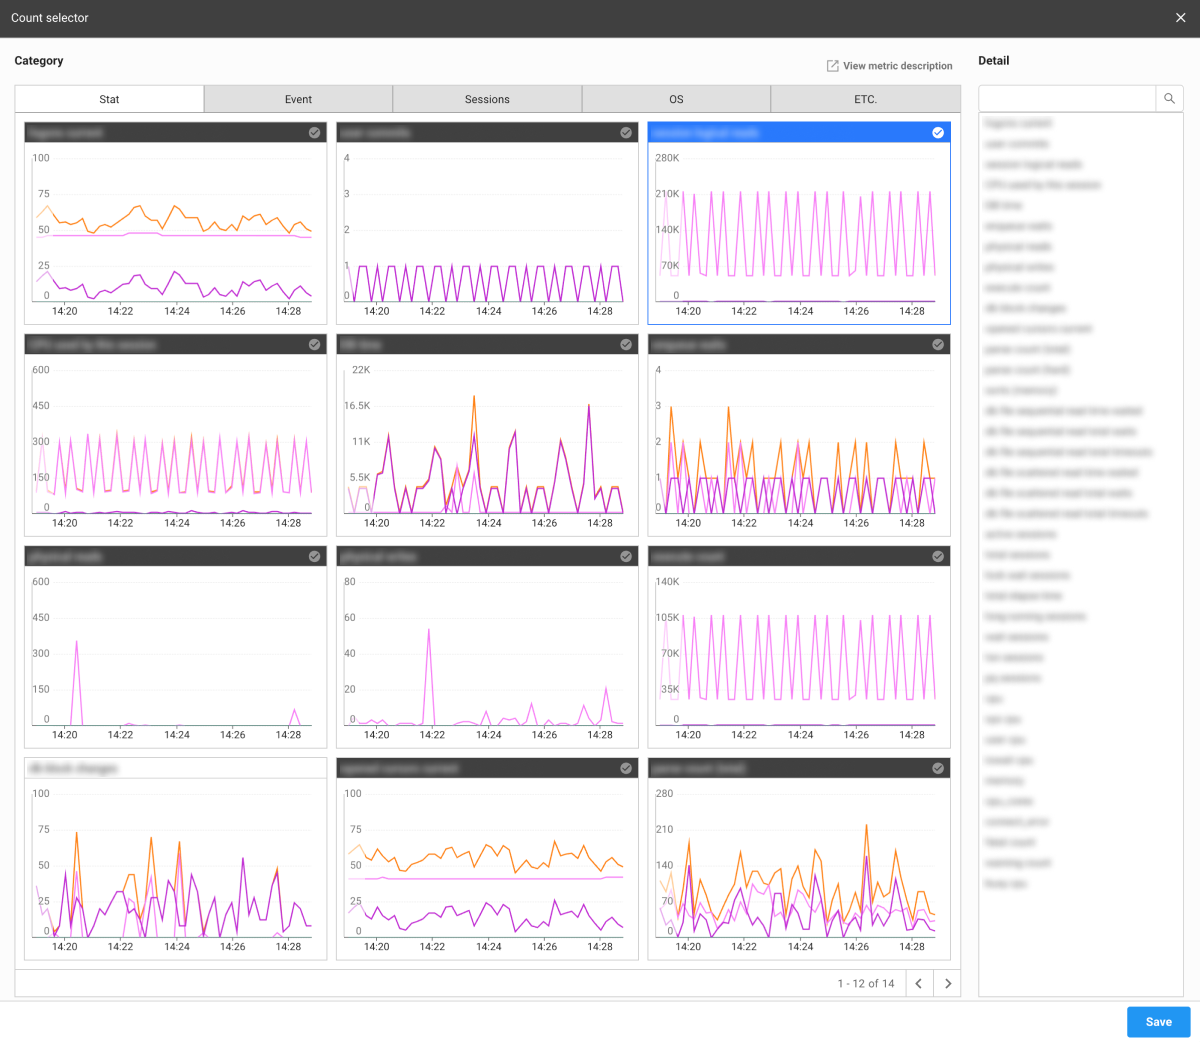
You can see the information of the database server collected in real time with a chart. On the upper right of each metrics chart, select . The Count window appears to select a chart.

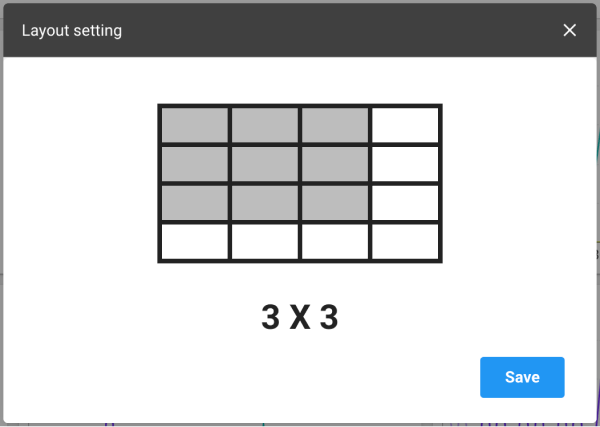
Layout setting
To set the layout on the metrics chart, on the upper right of the screen, select . Nine (3x3) metrics charts are set on the default layout, and you can change the number of charts on a page.

Using the active session area
Through Active Sessions at the bottom of the screen, you can see the real-time active sessions and query details. If you select the query item, you can check the full text and plan data of the query (query).
Using the event area
If an event occurs while monitoring the instances, its details are displayed in the event area on the right. If you select the event details, Analysis > Counts Trend appears. You can check the history of count trend and active sessions.
For more information about event-related analysis, see the following video clip.